Something about the market always feels like you’re looking at it through a house of mirrors… nothing is quite as it seems. The media seem to stir up a constant state of indecision about market motion with new opinions every day. And this makes it difficult for traders to fully grasp the current state of the market.
The swinging of the media pendulum between “the bears are in control” and “huge stock market gains assuage fears” leave most of us deciding to swear off the media (me, for close to a decade-literally, I have not watched financial television news- EVER).
Well, in an effort to clean up some mud in the market and clear up our vision of what’s happening in the market, I’d like to take a look (together) at the current state of the market.
We’ll look at what we know ‘technically’ about the stock market and finish by looking at what we expect to see and how we can trade the coming twists and turns in the market.
What we know:
- Broad stock market indices have been moving upward in general since 2009 (that’s around seven years if you don’t want to do the math)
- That means that we are in a strong market (until proven otherwise). Strong markets get bought up at any tests of near term support.
- Strong markets take a long time to reverse or retrace, and often retrace into shallow areas of reversal – the S&P 500 chart below is a perfect example of this, as well as the current state of the market – more on this below.
- With the recent dip in the S&P 500, we have essentially been sideways since the breach of 1857 in Feb, 2014 (this makes the region we just recaptured an attractive buy zone).
- As charts continue sideways, moving averages flatten.
- In the first week of December 2015, in the presence of these generally flat moving averages, we broke the weekly 10, 20, 50, and 100 simple moving averages. These averages were also quite close together (called a moving average squeeze), and we essentially fell below them within 2 weeks.
- We retested these moving averages and failed them in the weeks closing the year out.
- Since then, the market structure has been weak and buyers have failed to hold support until essentially today.
- This makes for a generally bearish environment where sellers are likely to sell the upward tests of old support now new resistance – BUT because 1857 is an attractive support regions value buyers will attempt a bounce into higher levels of resistance.
S&P 500 Index – A Look At The Bull Market
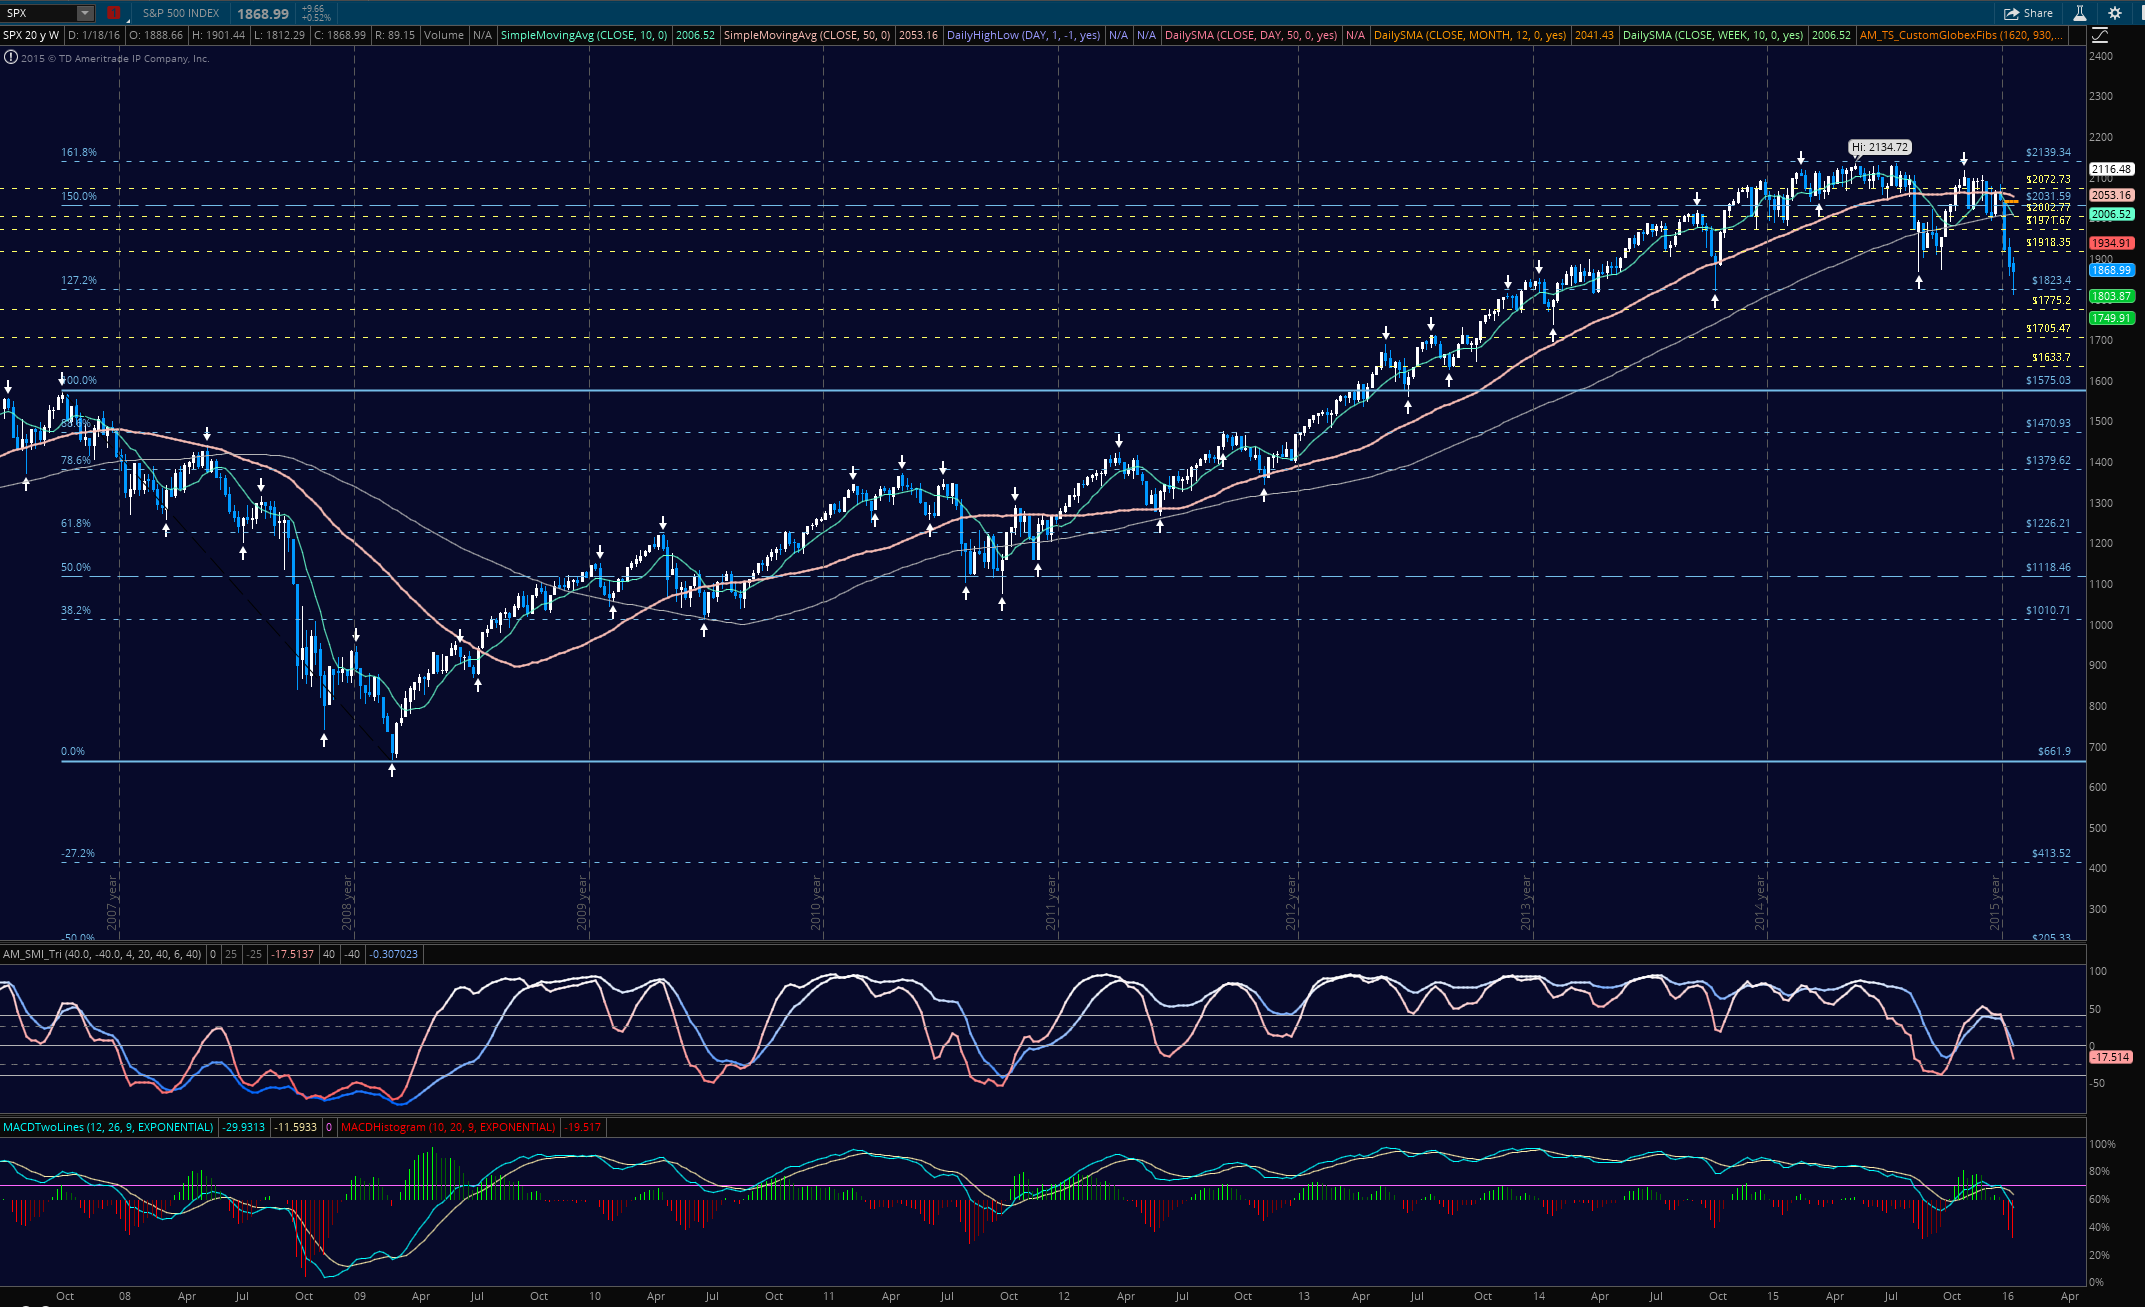
Retracement is a natural market motion that occurs after range expansion occurs – this range expansion has essentially continued from Feb 2009 to December 2015. That’s a long time, and markets will come in to test prior support regions.
To properly assess the state of the market, we must understand how strong markets act. Furthermore, if the market is still strong and still inside of range expansion or continuation, the S&P 500 should recapture 1971 and then 2017. Holding above those levels means we could easily test the prior highs. But that will not be easy.
If stocks are in a natural retrace, the S&P 500 Index will likely fail the 1971 region and head even lower than the lows we have recently seen. I suspect we will take a significant pause in the movement upward in the S&P 500, but I think it is going to take quite a bit of time. It is simply what broad market indices do from a technical perspective, but it seems clear that jagged motion is in our future for sure. That often happens from deep declines. After a reversion to the mean type move higher, we’ll see a “retest” and that should help us better understand the broad state of the market.
Caught inside that downward move will be lots of performing charts that will continue to rise and provide excellent buying opportunities as they come into deeper price support regions.
What we expect to see – a longer term view – over the next several weeks to months
- Charts are extended from these moving averages that were long at year’s end– the ‘reversion to the mean’ move, therefore, becomes quite likely as a tradable event for investors.
- There is a line in the sand currently near 1917-1919 on the S&P 500 will need to be broken and hold any retest. (Sellers will try to come in here at first pass to prevent the price action from advancing).
- In order to properly recover to the 2000 area, the market will need to show strength upon the recapture of the 1887-1889 area. That first, followed by a move above the 1919 area. This is the advance ahead I see as likely.
- We should then make jagged progress towards the 2003 to perhaps the 2011 area (though I think we eventually see a candlestick wick that forms as the market sells down from those higher levels).
- The bad news is that the chart is quite likely to roll over again from there and we resume the run downward into deeper retracements through the year. That is the way I see the current state of the market from a broad level.
If the chart fails to hold 1847 on the day (over the near-term), this would be an indication that the reversion to the mean bounce is not quite set up. And the chart should resume its trend lower. There are quite a few sellers near resistance and sellers are currently in control of this interim picture. Buyers still have a lot to prove.
SO, how can we trade this?
- Make sure the charts you are looking at have prevailing trends – whether long or short.
- Knowing the relative trend will tell you that on a big down day, you might be able to trade something like NKE of MCD long through the following up days of bouncing, if it comes into a primary support level on that big down day (yes, you need to know how to assess what that might be. HINT** – you could certainly use BIGGER moving averages to do this) – NOTE- NKE and MCD are strong stocks trending up currently.
- Vice versa –Consider shorting at resistance for stocks trending down (with tight stops).
- Consider shorting resistance and buying support instead of buying breakouts and selling breakdowns.
- Consider making your trading cycles a bit shorter if you are a swing trader – instead of a few weeks, perhaps you are only in for several days. If that level of movement makes you nervous because you don’t like trading that much, you might need to sit things out until we properly settle out.
- BE SENSITIVE TO CHANGE – watch your charts – market directions can change quickly. Being sensitive to change will create successful trading opportunities in what promises to be a very challenging environment this year
If you’re interested in the live trading room or learning more about how I trade, you can check my work out. Our live trading room is now primarily futures content, though we do track heavily traded stocks and their likely daily trajectories as well – we begin at 9am with a morning report and likely chart movements along with trade setups for the day. Visit TheTradingBook.com
As long as traders remain aware of support and resistance levels, risk can be very adequately managed to play in either direction as bottom picking remains a behavior pattern that is developing with value buyers and speculative traders.
Twitter: @AnneMarieTrades
The author trades stock market futures every day and may have a position in mentioned securities at the time of publication. Any opinions expressed herein are solely those of the author, and do not in any way represent the views or opinions of any other person or entity.


