Key Stock Market Takeaways:
– The bear market may be older than acknowledged.
– Small-caps are showing signs of life.
– Market breadth has improved, but thrusts are still elusive.
In this week’s Macro Update, it was noted that for all the volatility in recent weeks and months the stock market (as represented by the S&P 500) was back to where it was a year ago.
The heavy influence of a handful of mega-cap stocks has fueled strength in that index, and others that are so weighted. The five stocks that make up 20% of the weighting in the S&P 500 account for 45% of the weighting in the NASDAQ 100, and that index is actually in positive territory on a YTD basis.
Dependency on a handful of stocks has masked broadly based weakness in the past, and if they falter, could obscure broadly based improvements going forward. The strength of a rally is better determined by breadth of participation than degree of price gains.
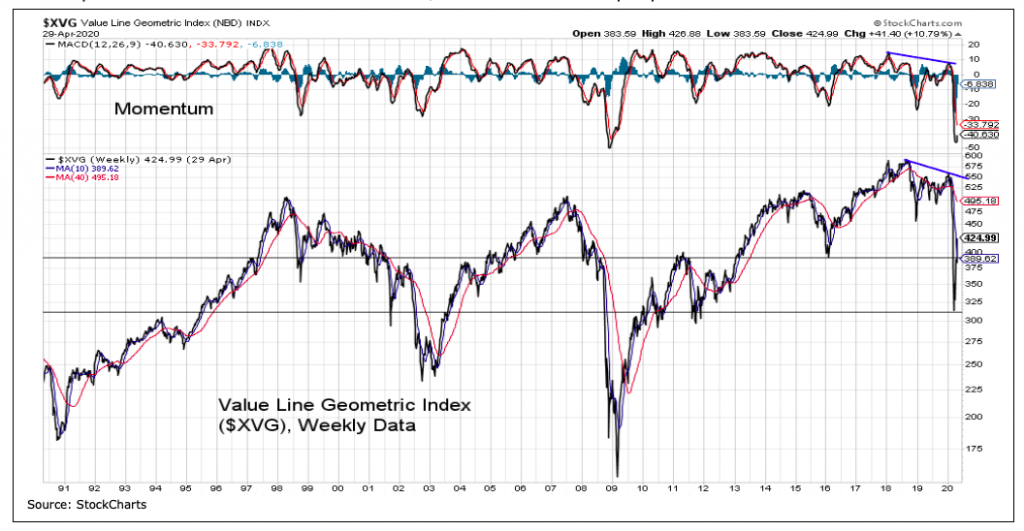
We are not the arbiters of economic cycles nor do we control the definitive labeling of bull/bear markets. The long-term chart of the Value Line Geometric Index, however, makes an increasingly compelling case that the weakness seen in Q1 of 2020 was an extension (and perhaps completion) of the weakness that emerged in Q4 2018.
Pockets of strength fueled new highs in the S&P 500 in 2019 (and early 2020), but the median stock across the Value Line multi-cap universe struggled to keep pace. The index itself never did get back to where it was in the summer of 2018. While this cyclical view would not preclude some testing of the March lows (time remains an under-appreciated element in the bottoming process), it would strengthen the argument that last month represented a durable low and not an initial low, at least from a breadth perspective.
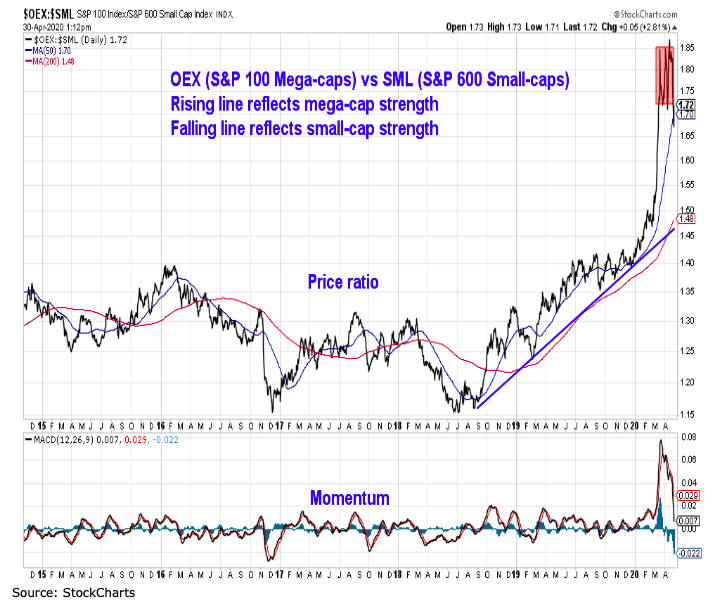
While that may be an interesting conjecture, the proof, as they say, will be in the pudding. Stocks tend to bottom prior to a recession’s end and small-caps tend to lead large-caps early in those new cyclical bull markets. After struggling a bit on a relative basis in the wake of the March S&P 500 lows, small-caps have caught fire. Leadership has shifted away from mega-caps and toward small-caps. With small-caps having made a nearly two-decade low versus large-caps, there may be some room for a durable rotation in leadership.
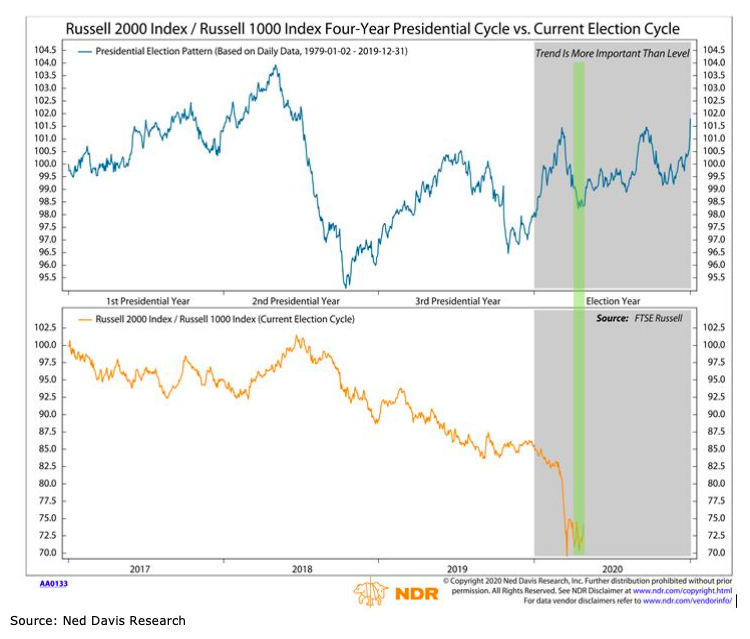
As we move into a new month, stocks overall will be entering a more challenging season. Everyone is probably familiar with the idea of selling in May and going away. Less well known is that with respect to the presidential election cycle, this would not be an altogether surprising spot from which to see small-cap leadership emerge. We will be looking for further evidence of a sustained shift toward small-cap strength in our industry group rankings.
Leadership shifts are not just about moving across capitalization levels. It can also be seen in the relative performance of the equal-weight S&P 500 versus the more familiar cap-weight index (which has been historically extreme). This may signal a shift in the rally from price-based strength to breadth-based strength. But we need more confirmation.
Since the March low, we have had multiple 9-to-1 up-days and have seen the percentage of stocks above their 10-day averages surge. Next on the breadth improvement list would be getting more than 55% of S&P 500 stocks to new 20-day highs (got up to 54.3% yesterday), seeing the 10-day advance/decline ratio above 1.9 (at 1.7 currently), and finally seeing 90% of stocks get above their 50-day average (currently 75%).
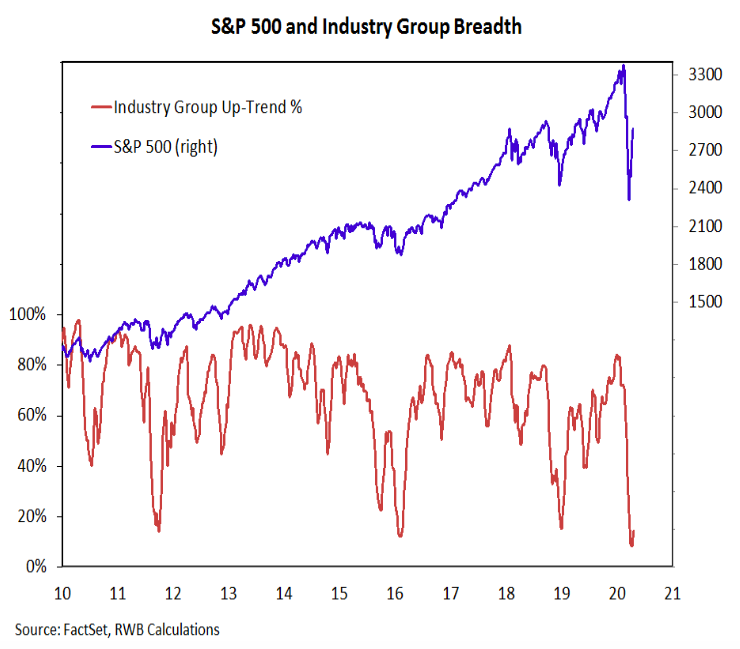
While the market is close on a lot of fronts to seeing evidence of sustainable improvement from a price and breadth perspective, it remains shy of important thresholds. Unfortunately, it’s kind of like new highs – it is bullish to get them but bearish to stop just short. Without a final push, the market may just be overextended and overbought within a longer-term downtrend. Absent additional evidence of breadth thrusts, it seems premature to get too excited about a rally that still has just 30% of S&P 500 stocks above their 200-day average and our industry group trend indicator still in the teens.
Twitter: @WillieDelwiche
Any opinions expressed herein are solely those of the author, and do not in any way represent the views or opinions of any other person or entity.
: Creating Bullish Divergence?")


: Creating Bullish Divergence?")