sellers showed up exactly where they were supposed to, pushing the price lower. In other words, at that point demand was simply overwhelmed by supply.
Support/resistance for the Semiconductors ETF at 52 goes back a year, and also approximates the 50-day moving average (51.31), hence worth a close watch. SMH retreated after tagging 51.75 on Wednesday (see Chart 3 above), and in the process retraced 50 percent of the June 1-August 24th decline.
That is also the case with the S&P 500 Index (1942.04). In fact, its 50-percent retracement of the May 20-August 24 drop lies at 2001. Selling pressure is showing up much earlier. On Wednesday, sellers came out of the woodwork near resistance at the 1990 level, which goes back to July last year (see Chart 4 below).
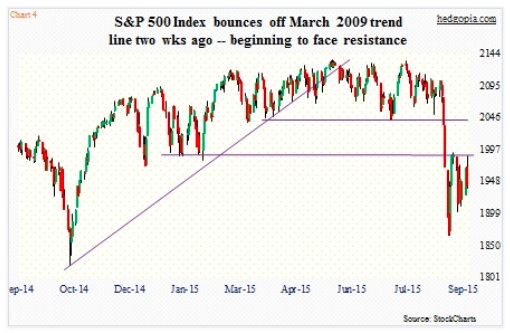
In an ideal scenario, the index would probably have a shot at 2040, where resistance is massive. That is also the area where, once broken, the waterfall decline in stocks began. If bulls are unable to push the index up to that resistance, one can argue they are playing with a weak hand.
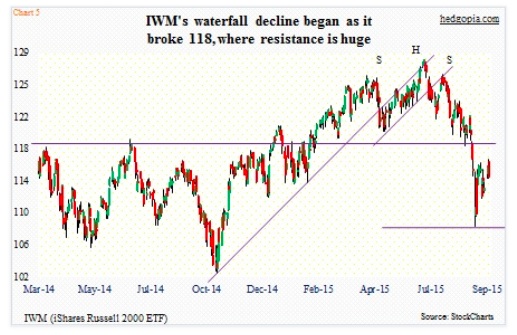
The same logic applies to the iShares Russell 2000 ETF (IWM). It has gone through a lot, acting weak since it broke the mid-October 2014 trend line in late April, tracing out a head-&-shoulders pattern and then proceeding to break the neckline (see Chart 5 below). Ideally, it would not be uncommon for the ETF to go test that broken support at 118. It did get to 116.42 on Wednesday, before selling off hard. Once again, if bulls cannot regroup and test that resistance, it likely gets interpreted as a sign of weakness.
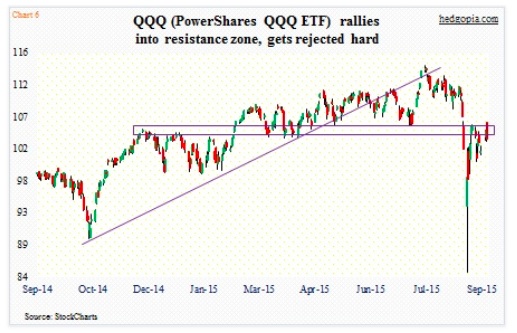
As well, the PowerShares QQQ ETF (QQQ) looked like it was breaking out of resistance in the 105-plus area early on Wednesday, but that momentum was lost, and then some, as the session progressed (see Chart 6 below). The session high of 106.31 was only a hair breadth away from the 200-day moving average of 106.60.
After the kind of drop these indices/ETFs have suffered, it is perfectly natural to fail at resistance – on the first try in particular – but several of them are getting sold off before important levels get tested.
Translation? Bulls have more work to do, before they can take advantage of Charts 1 and 2. In the remaining charts above, the RSI is below 50 in all but one. The Semiconductors ETF (SMH) has been unsuccessful in flirting with that level, and in all probability is headed lower – at least near-term. This can be a big tell. The Semiconductors have shown the way lately, and thus if the market heads lower, they will likely lead again on the way down.
Thanks for reading!
Twitter: @hedgopia
Read more from Paban on his blog.
No position in any of the mentioned securities at the time of publication. Any opinions expressed herein are solely those of the author, and do not in any way represent the views or opinions of any other person or entity.


