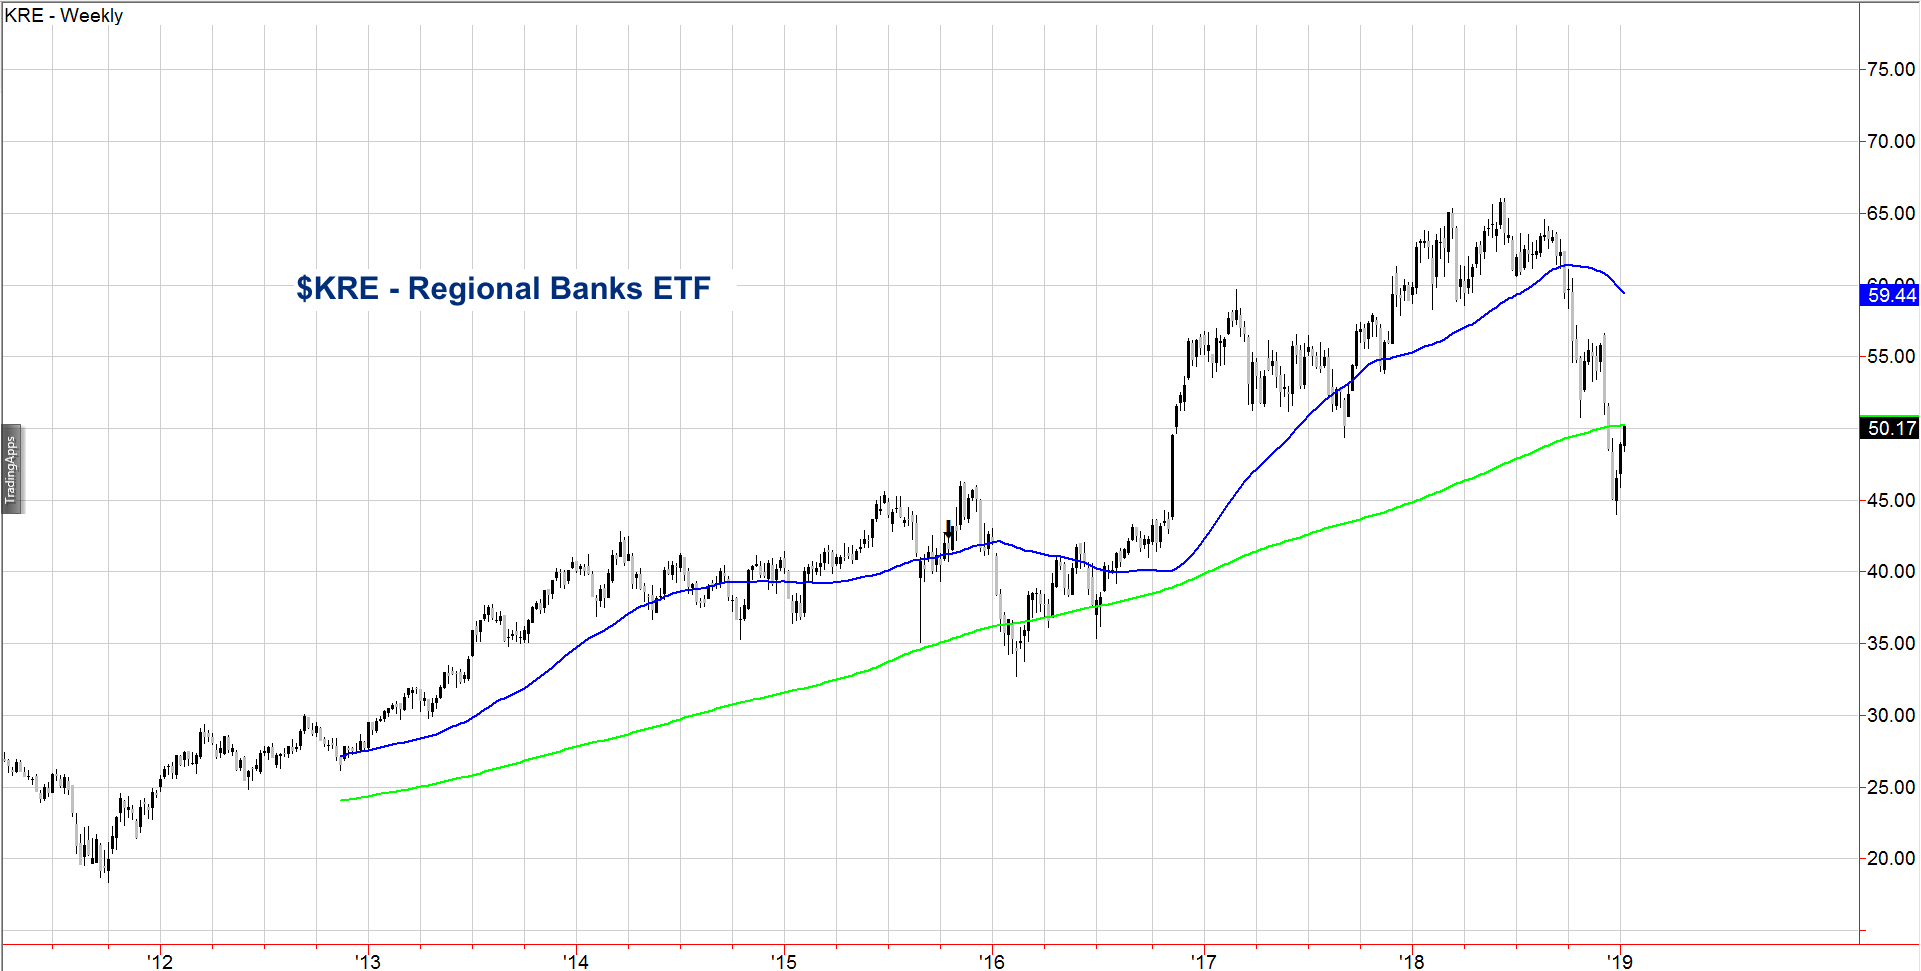
To simplify the analysis, I decided to focus on the Regional Banks ETF (NYSEARCA: KRE), or what I call the Prodigal Son of the Modern Family.
I named him as such because a prodigal is one who spends money in a recklessly, extravagant way.
The biblical reference is about the son who leaves home and behaves recklessly, only to later return asking for repentance.
In the parable, the son exhibited this behavior with his handling of his share of his father’s estate.
He spent all the money he had right away.
He didn’t think to save any of it.
He ate out every meal every day, bought fancy cars, and threw wild parties.
In the economic Modern Family, the Russell 2000 (NYSEARCA: IWM) is the Regional Banks (KRE) grandfather (close enough).
Therefore, no surprise that the generous Russell’s outperformed the other stock market indices, while KRE tackled some significant overhead resistance.
What lessons can we learn from the Prodigal Son and the weekly chart of KRE for this coming week?
The chart is a weekly one with two moving averages.
The green line is the 200 week moving average and the blue line the 50-week moving average.
Look back to the week after the last Presidential election or the week of 11/11/16.
The low that week was 43.60.
I find this incredibly significant as the low made the week of 12/28/18 was 43.95.
That’s a nearly perfect retracement from a 2-year breakout.
Also significant though, is that KRE was the first sector to break down in October 2018.
The Resional Banks ETF (KRE) failed the 50-week MA and gave the bears a comfortable ride.
Then, KRE was the first sector to break the 200-WMA.
Finally, the capitulation day came on 12/26 when it traded within inches of the 11/11/16 low and then turned around.
Since then, KRE has rallied nearly to the tick, to the 200-WMA at 50.25.
Meanwhile, IWM cleared the 200-WMA the week of 01/04/19.
So, one of two scenarios will emerge.
Either KRE fails to clear 50.25 hence, leading the charge lower once again (asking the bulls for forgiveness while dragging everything down with it).
Or, KRE clears the 200-WMA and Granddad Russell 2000, could become the first one of the indices to clear back over the 50-DMA and back into a Recuperation Phase.
For us, the moral of the story between KRE and IWM is that this rally, albeit sweet off the lows, also serves as a cautionary tale.
The market is a bit frothy and although it can continue up, remember-for now, the phases are still bearish in every index.
S&P 500 (SPY) – 259 is pivotal resistance with best underlying support at 255.
Russell 2000 (IWM) – 140 best underlying support and unless this can clear 145, we could see 140 soon.
Dow Jones Industrials (DIA) – 235 pivotal support-244.60 is the 50-DMA
Nasdaq (QQQ) – The 50 DMA at 162.50. Support at 156
KRE (Regional Banks) – Could not close the week over 50.25. 48.00 the must-hold support.
SMH (Semiconductors) – This did go into an unconfirmed Recuperation phase. Has to confirm with a second close over 91.28
IYT (Transportation) – This still has a long way to go to see the 50 DMA at 179.35. So for now, a close under 170 would not be a good sign
IBB (Biotechnology) – 110 next resistance with 106 closest support
XRT (Retail) – 43.75 the pivotal number for Monday. Above good, below we are looking at 42.25 support. Above we can see the 200-WMA looking at 44.80
Note that you can get daily trading ideas and market insights over on Market Gauge. Thanks for reading.
Twitter: @marketminute
The authors may have a position in the mentioned securities at the time of publication. Any opinions expressed herein are solely those of the author, and do not in any way represent the views or opinions of any other person or entity.


