Long-dated treasury bonds have been out of favor since the coronavirus market crash in February/March 2020.
Not only were bonds trading at the highs (and interest rates at multi-century lows), but the economy was counted out… until it wasn’t. The combination of a recovering economy and trillions of dollars passed by congress pressured interest rates higher (and bonds lower).
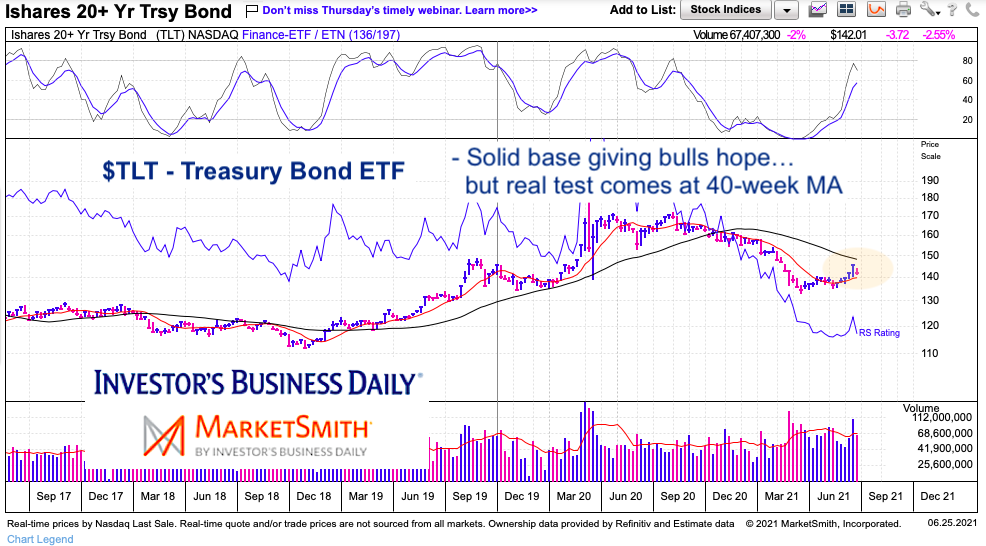
So where’s that put us today? Well, the 20+ Year Treasury Bond ETF (TLT) spent much of spring building a base in sideways trading. And recently, TLT has begun to move higher.
The trend is still lower but TLT is nearing a critical trend test. Today’s chart is simple, highlighting this and more on a long-term “weekly” chart.
Note that the following MarketSmith charts are built with Investors Business Daily’s product suite.
I am an Investors Business Daily (IBD) partner and promote the use of their products. The entire platform offers a good mix of technical and fundamental data and education.
$TLT 20+ Year Treasury Bond ETF “weekly” Chart
As one can see, TLT’s long-term trend (40-week moving average) is trending lower. Price is trading beneath this level but may be set for an important test as the short-term trend (10-week moving average) curls higher and converges with the 40-week ma.
Twitter: @andrewnyquist
The author may have a position in mentioned securities at the time of publication. Any opinions expressed herein are solely those of the author, and do not in any way represent the views or opinions of any other person or entity.


