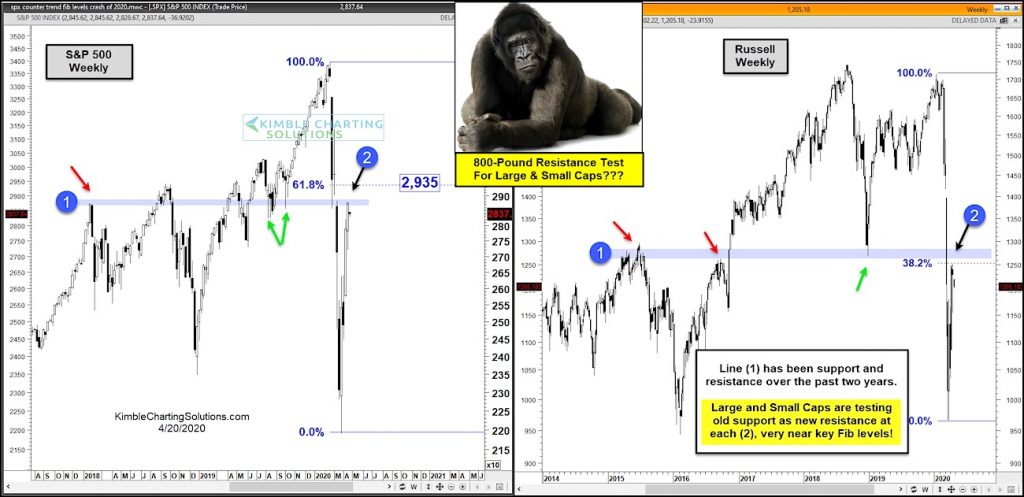
S&P 500 Index and Russell 2000 Index “weekly” Charts
The stock market rally from the March crash lows has been sharp but lumpy.
The S&P 500 Index and large cap stocks have lead the way higher, while the Russell 2000 Index and small cap stocks have lagged.
That said, today’s chart highlights a significant overhead price hurdle for both large and small cap stocks.
The S&P 500 Index is approaching at key pivot point level at (1) as well as its 61.8 percent Fibonacci retracement at (2). This confluence of resistance looks very important.
The same can be said for the Russell 2000 Index. It is approaching an important pivot point marked by prior highs and lows at (1), as well as its 38.2 percent Fibonacci retracmeent at (2). Again, very important.
And since this is occurring at the same time, it’s best to respect that level and watch for how price behaves here. Stay tuned!
Note that KimbleCharting is offering a 2 week Free trial to See It Market readers. Just send me an email to services@kimblechartingsolutions.com for details to get set up.
Twitter: @KimbleCharting
Any opinions expressed herein are solely those of the author, and do not in any way represent the views or opinions of any other person or entity.


: Showing Some Signs of Emerging Strength")
