In this post, I’ll make an observation that shows how simple investing can be.
Large cap stocks (i.e. the S&P 100 Index) have been en vogue and out-performed smaller cap stocks.
This isn’t a comment about today’s trade; rather, it’s a longer-term observation. We do this by looking at performance over a longer-term duration and compare charts and market returns (or perhaps a ratio chart).
Pretty simple. And this can be applied across sectors and stocks (and over intermediate or shorter-term durations). Compare the major industries and sectors to find current leaders, or better yet, emerging leaders. Then find stocks within those “leading” sectors.
Note that the following MarketSmith charts are built with Investors Business Daily’s product suite.
I am an Investors Business Daily (IBD) partner and promote the use of their products. The entire platform offers a good mix of technical and fundamental data and education.
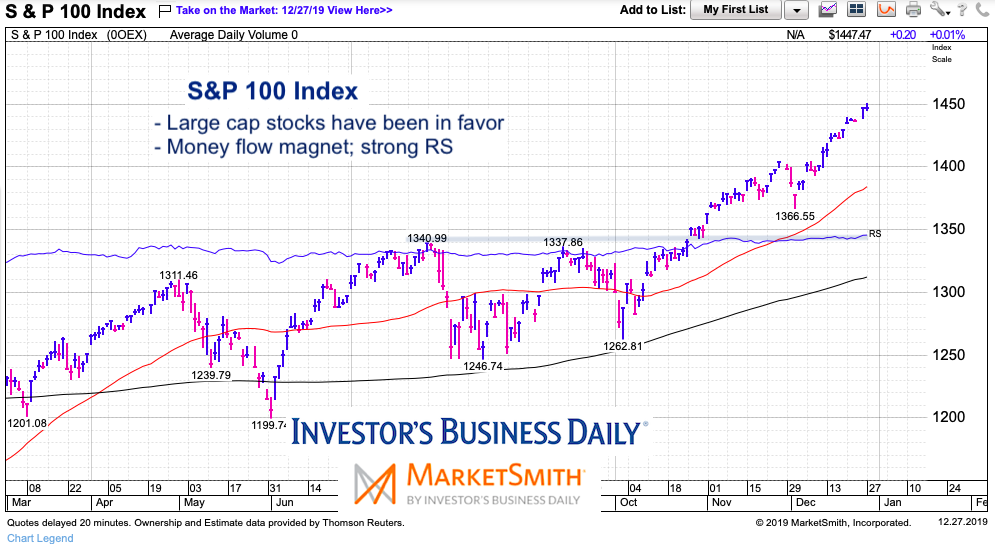
S&P 100 Chart
The chart below is of the S&P 100 Index. A picture is worth a thousand words. Large cap stocks have been very strong.
While the S&P 100 is making new all-time highs, the Russell 2000 small cap index is still off its 2018 highs. Again, this is a longer-term observation (small caps have been performing better of late). Over the past 2 years, large caps have been very strong.
Twitter: @andrewnyquist
The author may have a position in mentioned securities at the time of publication. Any opinions expressed herein are solely those of the author, and do not in any way represent the views or opinions of any other person or entity.


