On Tuesdays in the summer Mish (Michele) has been simplifying the market commentary.
So I’m going to do the same while she is away. And today, that translates into “An Interesting Chart.”
When the market has a volatile move, I identify consolidation and a reversal inflection level as quickly as possible.
Today, none of the Modern Family or market ETFs closed lower or even trade lower than yesterday’s low. This defines levels that we can now use to determine consolidation ranges.
In general, this means watch out for any Modern Family member breaking the range of the last two days.
Below you’ll find a daily chart of the NASDAQ futures. The moving averages are 10 (magenta), 50 (blue), and 200 (green).
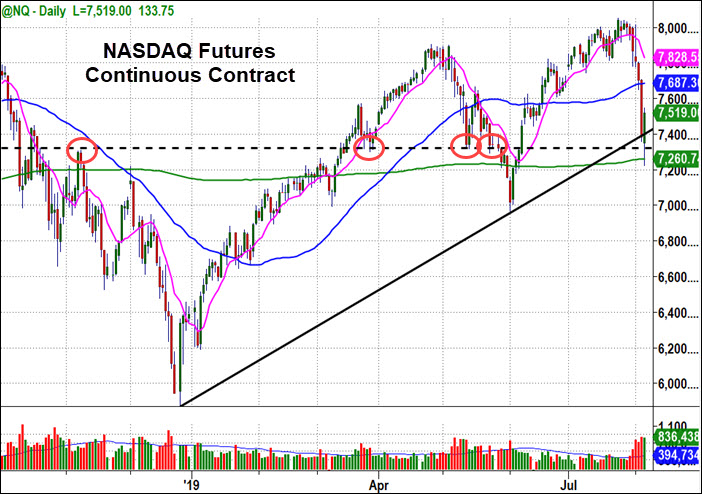
The futures trade all 24 hours of the day, and the days end in this chart at 6 pm ET.
As a result, this chart reflects the market’s immediate reaction to China been designated as a ‘currency manipulator’ by the White House.
As you can see in the chart, after the stock market’s regular trading hours closed, the futures continued lower. What you don’t see is that it was a violent drop.
Notice that the drop stopped and reversed at the 200 DMA.
I like to look at the 24-hour futures charts because they often define turning points that are not as obvious if you’re only looking at the QQQ.
In this case, the scary negative ‘currency manipulator’ news right after a day when the market had already plunged, may have created a capitulation low right at the 200 DMA.
In addition, you can see the solid trendline from the December 2018 low, creates another level of support.
Finally, I added the horizontal dashed line to illustrate how pivotal the 7,330 level has been over the last 7 months (and even going further back).
That’s “bad new good action” and three technical reasons the market should have found support at these levels.
It’s probably optimistic to think that yesterday was a long-term low, but there’s good reasons to look for a bounce.
More importantly, if all these technical levels get broken, it could be very bad news for the bulls.
Keep your eye on this chart, draw the same trend lines on your QQQ chart, and keep your eyes on the 200 DMA!
Stock market ETF Levels:
S&P 500 (SPY) Support at Tuesday’s low, 248.28, the swing low, 281.72. Big support area is 280 to 277.70 (the 200 DMA). Resistance at 288.21 and gap fill at 290.90.
Russell 2000 (IWM) Support at Tuesday’s low, 147.38, the swing low, 146.21. Next big support is 145.30. Resistance at 150 and gap fill at 151.28 which is also near the 2000 DMA
Dow (DIA) Stopped at the 200 DMA. Support at Tuesday’s low, 257, the swing low, 255.13. Next support levels are 252.50 and 247. Resistance at 261.15 and gap fill at 262.43.
Nasdaq (QQQ) Swing low is at a trendline from the December 2018 low. Support at Tuesday’s low, 181.07, the swing low, 179.20. Big support is the 200 DMA at 175.65.
KRE (Regional Banks) Big support at swing low, 50. Big resistance at 52, then at 50 DMA, 52.80.
SMH (Semiconductors) Opened over 50-DMA and PDH, but spent the day under it. A move over 110 will be interesting. 200 DMA is 102.40. Gap fills at 114.46.
IYT (Transportation) Support at 179.20. Next big support is 175. Big Resistance at 185 (200 DMA).
IBB (Biotechnology) 101 is big support. 104 has been pivotal since April. Big resistance around105.
XRT (Retail) Traded and closed well over PDH. Support area at 40.30-40.00 Major resistance around 42.
Geoff Bysshe is filling in for Mish until August 24th.
Twitter: @marketminute
The author may have a position in the mentioned securities at the time of publication. Any opinions expressed herein are solely those of the author, and do not in any way represent the views or opinions of any other person or entity.


