Last Thursday the S&P 500 (SPY) and the Nasdaq 100 (QQQ) tested new highs and then gapped lower on Friday showing that the market still had some overhead resistance.
Driving reasons could be related to fears of inflation raising as the U.S pushes to take on more debt, to caution from pending earnings as Monday starts another round of incoming reports.
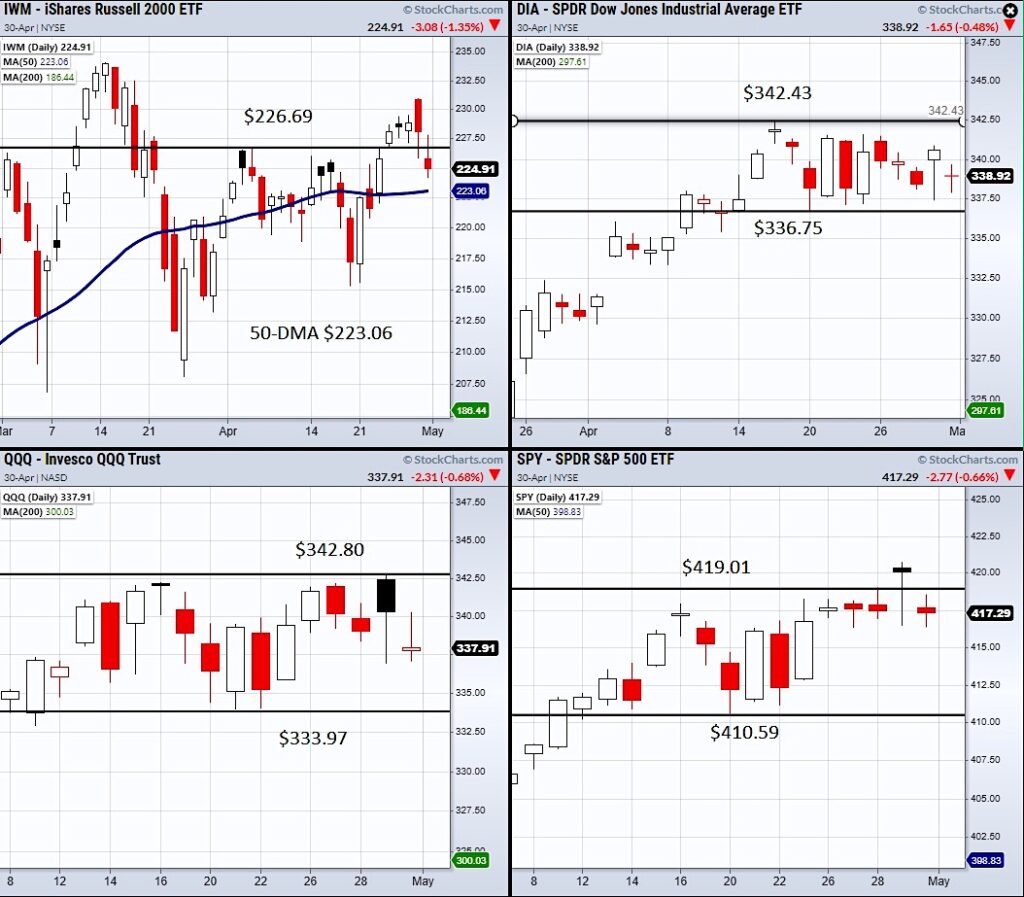
Additionally, the Russell 2000 (IWM) has pulled off and could be looking for another revisit of its 50-Day moving average at $223.28.
With that said, we can also factor in the major indices’ current price range.
In the above charts, each has a range created by their recent highs, lows, or in the case of IWM support from 50-DMA.
This can give us clear support and resistance levels to reference and trade-off in the coming week.
Also, when it comes to using these price levels to determine a potential breakout or breakdown in the market it can help to watch if the indices are pushing through the price levels at the same time.
This can help with fake breakouts or breakdowns like we saw this week in SPY and the QQQs.
Stock Market ETFs Trading Analysis & Summary:
S&P 500 (SPY) 10-DMA at 416.24 pivotal.
Russell 2000 (IWM) Next support the 50-DMA at 223.26.
Dow (DIA) 336.75 support.
Nasdaq (QQQ) 333.97 support.
KRE (Regional Banks) Support 67.22.
SMH (Semiconductors) 242.29 support the 50-DMA.
IYT (Transportation) Closest support the 10-DMA at 265.98.
IBB (Biotechnology) 153.51 pivotal.
XRT (Retail) Like this to hold over the 10-DMA at 92.41.
Twitter: @marketminute
The author may have a position in mentioned securities at the time of publication. Any opinions expressed herein are solely those of the author and do not represent the views or opinions of any other person or entity.


