Yesterday we heard a discordant orchestra.
Today, the crescendo that had built up in NASDAQ, turned into decrescendo.
And while NASDAQ sold off hard, the rat-a-tat of the Russell 2000, Retail, Regional Banks, and Granny Retail sectors from yesterday, sounded more like cymbal crashing today.
However, this level of volatility is nothing new.
Earlier in the week I wrote, The Market Will Not Go Down Unless…
– The death rate from COVID-19 spikes- not the number of cases.
– The dollar keeps failing while the yuan grows in demand.
– The civil unrest surges to the point of riots, hence unavoidable disruption.
– War breaks out in North Korea or Middle East.
Cases are spiking, but so far, not the death rate. The dollar rose a bit. Civil unrest remains, but under control. And thus far, no war mongering appears on the horizon.
So while the orchestra of the market played its discordant notes in unison, does this mean the market has topped?
This is when I like to look at the weekly charts to gain some perspective.
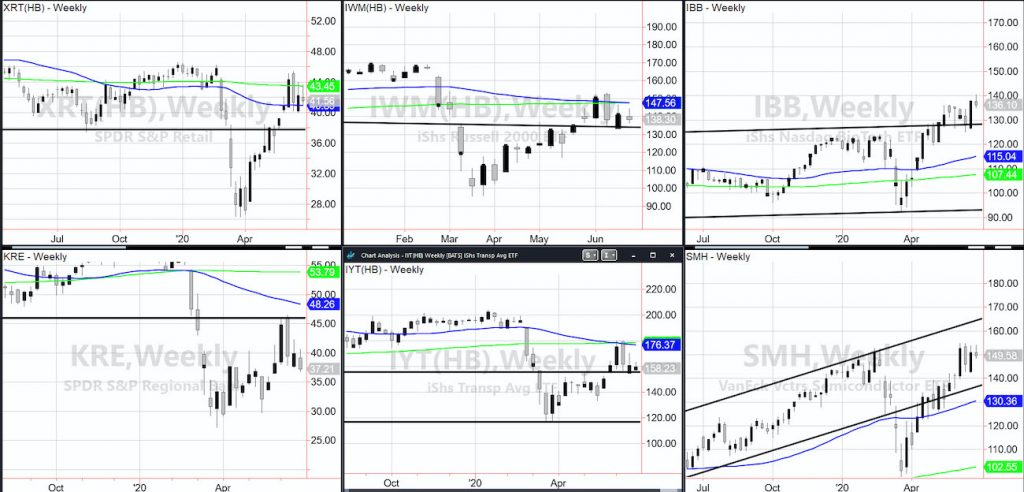
Retail XRT still sits above the 50-week moving average and the 200-DMA.
The Russell 2000 IWM is under both the 50 and 200-WMAs but having an inside week thus far (inside last week’s trading range).
Biotechnology IBB sits on the breakout level or around 136.
Regional Banks KRE is also having an inside week-and after testing its 50-DMA intraday, closed above it keeping the recuperation phase alive.
Transportation IYT, is also having an inside week as well as our sister Semiconductors.
If we take a further probe into our strongest sector, SMH back through 152 hits a sweeter note.
And if we take a further probe into the weakest sector KRE, if it holds around 37.00 and can clear back over 38.70, that would also keep the music alive.
Wall Street Multimedia, Inc. Interview from, 06-23-20 https://www.youtube.com/watch?v=tiBVLArRNlk&feature=youtu.be Great Overview!
And, Your Daily Five with StockchartsTV today The “Stagflation Scenario.” A-9 minute listen https://www.youtube.com/watch?v=G0pIXJaxmhM&feature=youtu.be
S&P 500 (SPY) 302 held, 308.50 resistance
Russell 2000 (IWM) 140-141 now resistance and 133.52 the 50-DMA
Dow (DIA) 249 the support and 260 resistance
Nasdaq (QQQ) Classic reversal top now but still holding support at 242.25
KRE (Regional Banks) 37.00 major support held and has to. 39 resistance
SMH (Semiconductors) Inside weeks- 139.78 last week’s low-155 resistance 152 pivotal
IYT (Transportation) 161 resistance 153 support
IBB (Biotechnology) 136 support then 134
XRT (Retail) 200-DMA 40.50 support holding 43.50 resistance
Volatility Index (VXX) 34.50-38.50 range
Junk Bonds (JNK) 100 big support
LQD (iShs iBoxx High yield Bonds) 130.54 seems inevitable
Twitter: @marketminute
The author may have a position in the mentioned securities at the time of publication. Any opinions expressed herein are solely those of the author, and do not in any way represent the views or opinions of any other person or entity.


 Pressuring Lower Price Support")


 Pressuring Lower Price Support")