In retail, employees are often told that the consumer is always right. While this isn’t always true, it is a reminder that patient customer service usually wins the day.
In investing, it also appears that the consumer is always right. BUT it depends on which consumer.
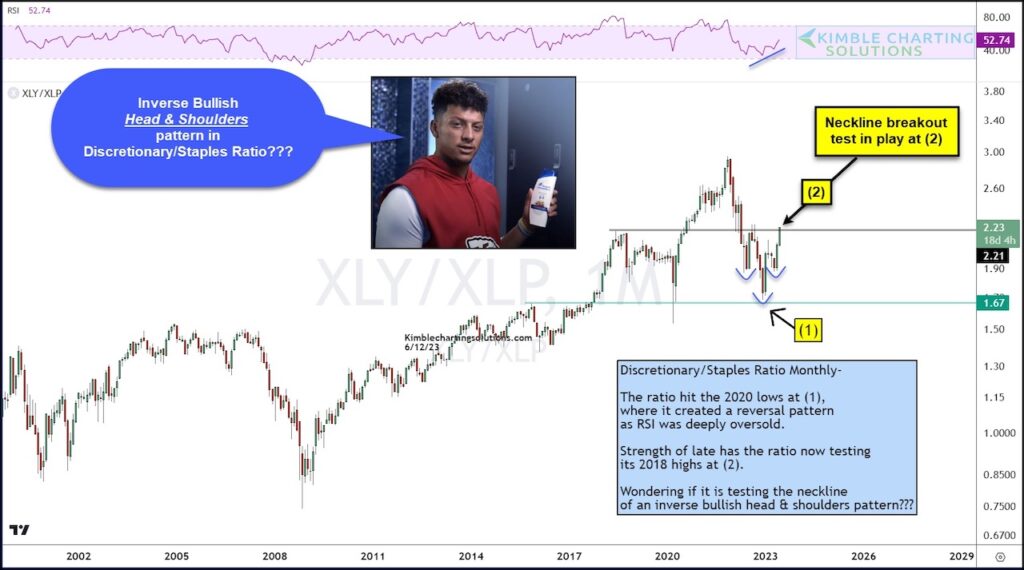
In today’s chart we highlight a key consumer ratio over a long-term “monthly” timeframe: the Consumer Discretionary ETF (XLY) to the Consumer Staples ETF (XLP).
Since Discretionary represents bullish “additional” spending and staples represent bearish “essential” spending, it is important for bulls to see this ratio heading HIGHER.
Looking at the chart, we can see that the XLY/XLP ratio formed a low near the 2020 low at (1) and is showing strength while testing the 2018 and 2022 highs at (2). The price action has formed a bullish inverse head & shoulders pattern that is testing resistance at the neckline.
This appears to be a big test for the XLY/XLP ratio at (2). A breakout here would be HUGE for stock market bulls. Stay tuned!
Consumer Discretionary $XLY to Consumer Staples $XLP Ratio Chart
Note that KimbleCharting is offering a 2 week Free trial to See It Market readers. Just send me an email to services@kimblechartingsolutions.com for details to get set up.
Twitter: @KimbleCharting
Any opinions expressed herein are solely those of the author, and do not in any way represent the views or opinions of any other person or entity.


 Trading Into Inflection Point")
