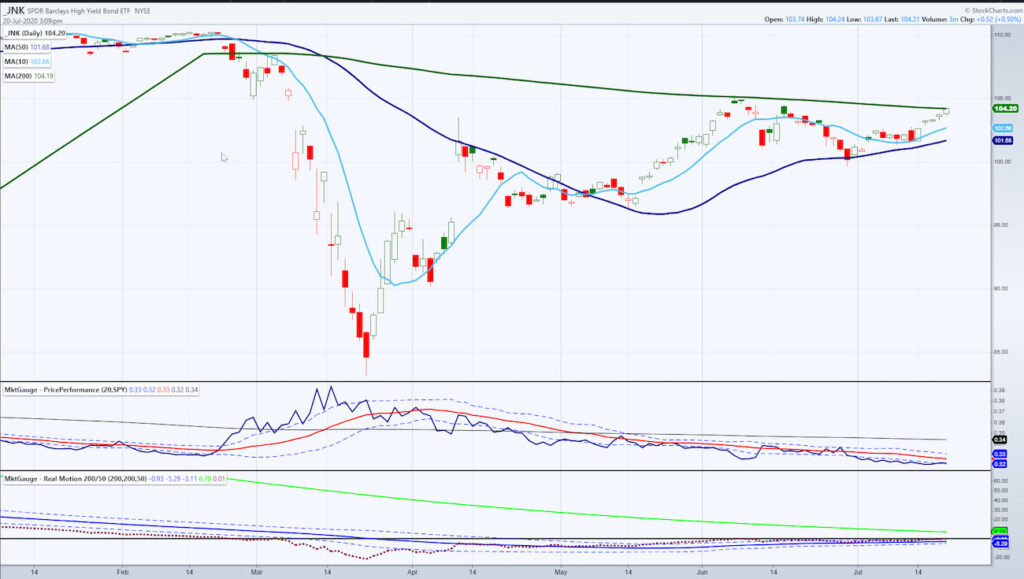
With such divergence glaringly apparent in the stock market, I like to look at junk bonds.
The Junk Bonds ETF NYSEARCA: JNK helps us see risk appetite.
Last week I did a piece on Junk Bonds (JNK) when they appeared more vulnerable, skidding along the 50 daily moving average you see in blue.
Then, buyers showed up in junk, along with the rest of the stock market.
However, with the surge in growth stocks today (small caps and in NASDAQ) while the Russell 2000 index and the Regional Banks, Retail, and Transportation sectors all closed red, I’m looking for some more clues to see if this divergence is sustainable.
I am wondering if this move in growth stocks has anything to do with actual growth. Are they forward thinking, or foreshadowing of a bubble in the making?
I lean towards bubble since we see no real growth in the real economy reflected in these weaker sectors.
Plus, with silver blasting off today and gold holding well, I just cannot quit the stagflation theory.
The price on JNK has run right into resistance at the 200 daily moving average.
In fact, the price cleared by 12 cents to be exact with the 200-DMA at 104.19.
Now this is important for a few reasons.
First, the price must confirm for a second day above the 200-DMA for a phase change to accumulation.
Second, on the weekly chart, the 50-WMA comes in a bit higher at 104.94. So, it can confirm on the daily, run up in price some more, and then stall.
Or, it can just stall on Tuesday and not confirm, thereby closing under 104.19.
Third, the price performance compared to our benchmark clearly shows a big underperformance. That means that the run into stocks surpasses the risk appetite for junk bonds.
As junk bonds have a higher risk of default than high-grade bonds, in the current environment that they underperform is not that surprising.
But, should we start to see selling in the junk bonds, I would take that as an early warning sign for equities as well.
Finally, and perhaps the biggest concern is what Real Motion is showing.
While the price is above the 200-DMA (green line), the RM indicator is way below it. Momentum is nowhere near price.
This momentum to price divergence is yet another one of those market divergences that can keep bulls up at night.
Should JUNK bond prices begin to falter here, take heed as momentum can be a leading indicator.
Should the momentum begin to move up, that will be a sigh of relief for the bulls, and for our laggard Economic Modern Family index and sectors.
S&P 500 (SPY) Above the June high. I have been bullish but now finding it a bit hard to breathe the thin air up here. 318.50 support
Russell 2000 (IWM) 146 support 150 resistance-consolidating at the 200-DMA.
Dow (DIA) 262.50 support 270 resistance-maybe a bull flag
Nasdaq (QQQ) A potential bear flag became a bear trap. 263 now support
KRE (Regional Banks) back to bearish phase-34 support 37.70 resistance
SMH (Semiconductors) 160 support 165 resistance
IYT (Transportation) Back under the 200-DMA making 172.75 pivotal
IBB (Biotechnology) Another new all-time high
XRT (Retail) 45 pivotal 44.35 support
Volatility Index (VXX) Took out the early June low and came back above it 28.83. A move over 30.40 would interest me
Junk Bonds (JNK) 104.25 resistance
LQD (iShs iBoxx High yield Bonds) High yield appetite with this making new all-time highs
Twitter: @marketminute
The author may have a position in the mentioned securities at the time of publication. Any opinions expressed herein are solely those of the author, and do not in any way represent the views or opinions of any other person or entity.


