The following is a recap of the June 3 Commitment Of Traders Report (COT) released by the CFTC (Commodity Futures Trading Commission) looking at COT data and futures positions of non-commercial holdings as of May 31. Note that the change in COT report data is week-over-week. This blog post originally appeared on Hedgopia.com – Paban’s blog.
Trading Insights and Analysis from the June 3 Commitment Of Traders Report
Economic Releases:
It is a relatively light week for economic releases.
Revised productivity numbers for 1Q16 come out on Tuesday. The preliminary estimate showed non-farm output per hour decreased at a one-percent annual rate. Year-over-year, productivity increased 0.6 percent.
Also on Tuesday is published consumer credit for April. March was $3.59 trillion (seasonally adjusted), up 0.8 percent month-over-month and up 6.6 percent year-over-year. Most notably, student loans now stand at $1.35 trillion and auto loans at $1.05 trillion (both not seasonally adjusted) – up respectively from $710.9 billion and $742 billion in June 2009.
Wednesday brings JOLTS for April. Job openings increased 149,000 in March to 5.76 million. In November last year, they had dropped to as low as 5.2 million. That said, openings have essentially gone sideways since last July’s 5.79 million.
The University of Michigan’s consumer sentiment for June (preliminary) is published on Friday. It jumped 5.7 points in May to 94.7 – the highest since last June. Sentiment peaked at 98.1 in January 2015 – an 11-year high.
EQUITIES
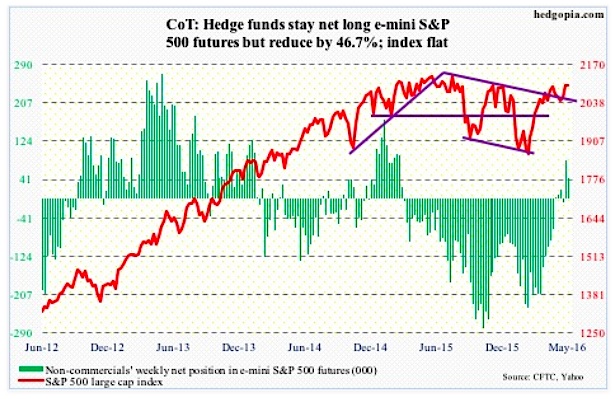
E-mini S&P 500: The ‘sell in May, and go away’ adage did not pan out this year. The S&P 500 gained 1.5 percent in the month. On April 20th (intra-day high), it was merely 1.1 percent from the all-time high 2134.72 in May last year. Thus completes one whole year without a new high.
It will be a major win for the bulls if the S&P 500 somehow manages to decisively break out of this one-year consolidation. ‘Decisively’ is the key word here. And for that to happen, new sources of buying need to emerge. So far, corporate buybacks have been the only reliable source.
Foreigners have been net sellers of U.S. equities for a while now. NYSE margin debt is way off the $507.2-billion peak in April last year, with April this year at $455.6 billion. And flows continue to disappoint.
In the week ended Wednesday, $776 million came out of U.S.-based equity funds. Since the week to February 10th, north of $43 billion has been redeemed (courtesy of Lipper).
In the same week, SPY, the SPDR S&P 500 ETF, attracted $384.5 million, but lost $2.6 billion in the last three sessions (courtesy of ETF.com).
With daily conditions overbought, selling pressure is starting to emerge. The good thing is, bulls were able to defend the 2085 region for six straight sessions, including on Friday. However, the daily chart now has three consecutive hanging man candles – potentially bearish.
June 3 Commitment Of Traders Report: Currently net long 44.4k, down 39k.
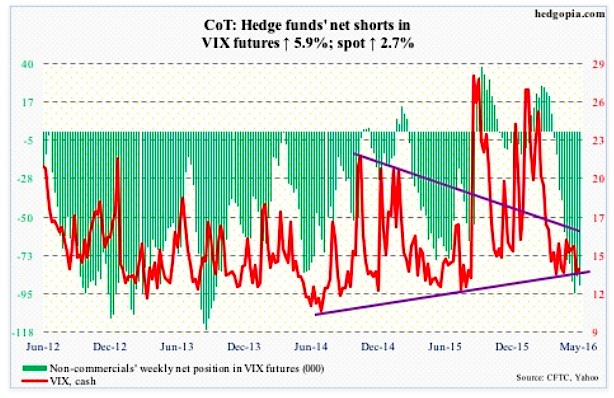
VIX Volatility Index: The 50-day moving average on the VIX is flattish, and trying but struggling to rise. Throughout this week, spot VIX tried to rally past the average, but was denied.
The range-bound action continues. Ditto with the VIX-to-VXV ratio, which has been languishing in oversold zone – high-0.70s to low-0.80s – for 12 weeks now. The longer this goes on, the higher the odds of a sustained rally – eventually.
June 3 Commitment Of Traders Report: Currently net short 90.3k, up 5k.
COMMODITIES
Crude Oil: There you go!
After all the pre-meeting talk/rumors of an impending deal, OPEC on Thursday failed to agree on a new production ceiling.
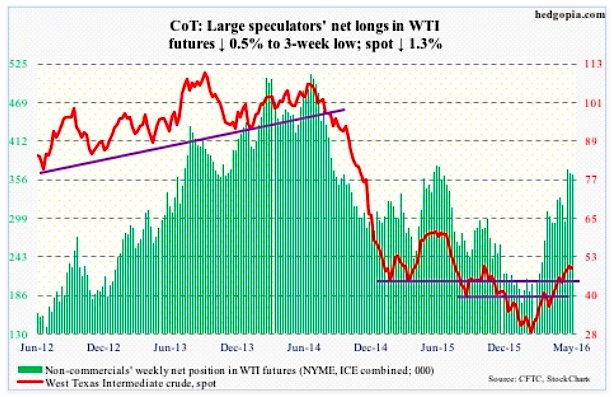
With no deal, and crude oil having rallied big into the meeting – nearly 93 percent between the February 11th low and the May 26th high – the odds of a pullback have grown. The question is of magnitude and duration.
Needless to say, spot West Texas Intermediate crude remains overbought. There is plenty of unwinding left on a weekly chart. That said, daily momentum is yet to break, with the 10-day moving average flattish and the 20-day still pointing up.
The path of least resistance remains down.
On Thursday, post-OPEC disappointment, crude was under pressure, but the weakness was bought, reacting to the U.S. weekly data.
For the week ended May 27th, inventory was down across the board.
Crude stockpile dropped by another 1.4 million barrels to 535.7 million barrels. Inventory is now down 7.7 million barrels from the April 29th high of 543.4 million barrels, which was the highest since the all-time high 545.2 million barrels in October 1929.
Gasoline stocks fell by 1.5 million barrels to 238.6 million barrels. Inventory is now down by 20 million barrels from the February 12th high of 258.7 million barrels.
Along the same lines, distillate inventory fell by 1.3 million barrels to 149.6 million barrels – now down 15.9 million barrels from the January 8th high of 165.6 million barrels.
Crude production, too, fell, by another 32,000 barrels per day to 8.74 million b/d. This was the 12th straight weekly drop and eighth sub-nine mb/d. Production peaked at 9.61 mb/d in the June 5th week last year.
Refinery utilization rose one-tenth of a point to 89.8 percent.
On the negative side, crude imports increased by 524,000 b/d to 7.84 mb/d – a six-week high.
June 3 Commitment Of Traders Report: Currently net long 363.3k, down 1.8k.
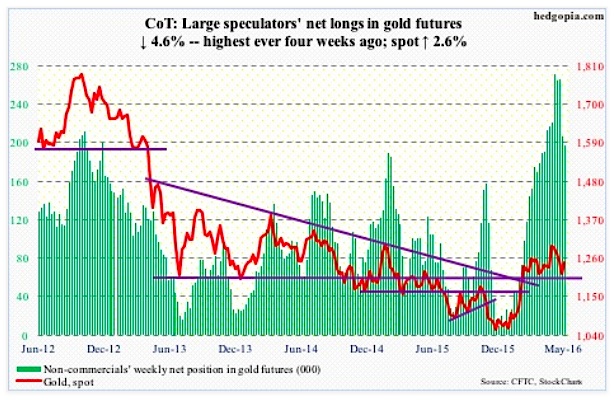
Gold: Spot gold produced a hammer session on Tuesday, with buyers showing up on crucial support. The metal has essentially been sideways the past four months, and was in the process of testing the lower bound of the range.
Daily technicals were grossly oversold, with the price hugging the 100-day moving average in the four sessions leading up to Friday. Post-jobs report, the yield curve shifted lower, with short-term rates in particular taking it on the chin.
Spot gold took off, up 2.5 percent on Friday, with plenty of room to continue to rally.
Non-commercials cut back a little. But this was prior to Friday’s move. Next week’s will reflect their true intention. Net longs were the highest four weeks ago, and have come down since.
June 3 Commitment Of Traders Report: Currently net long 197.1k, down 9.5k.
continue reading on the next page…


