July 12 Stock Market Futures Trading Outlook – As suspected, shallow pullbacks became buy zones for most traders, and overnight stock market futures have moved to new highs.
S&P 500 futures sit close to near term resistance of 2141 (roughly 2148 on S&P 500 Index – INDEXSP:.INX). There is some weakness showing up beneath price. Nevertheless, the charts for stock market futures will be governed by buyers – so I’ll be watching the shallow pullbacks for buying opportunities. That said, traders need to stay alert for a lower high that might set in. Watching order flow yesterday, it showed some very big traders taking big bets in both directions right at the contention region of 2134. S&P 500 futures support lies near 2130-2134, and resistance is near 2141-2143. Range expansion could take that to 2157 easily in this environment.
See today’s economic calendar with a rundown of releases.
RANGE OF TODAY’S MOTION
E-mini S&P Futures
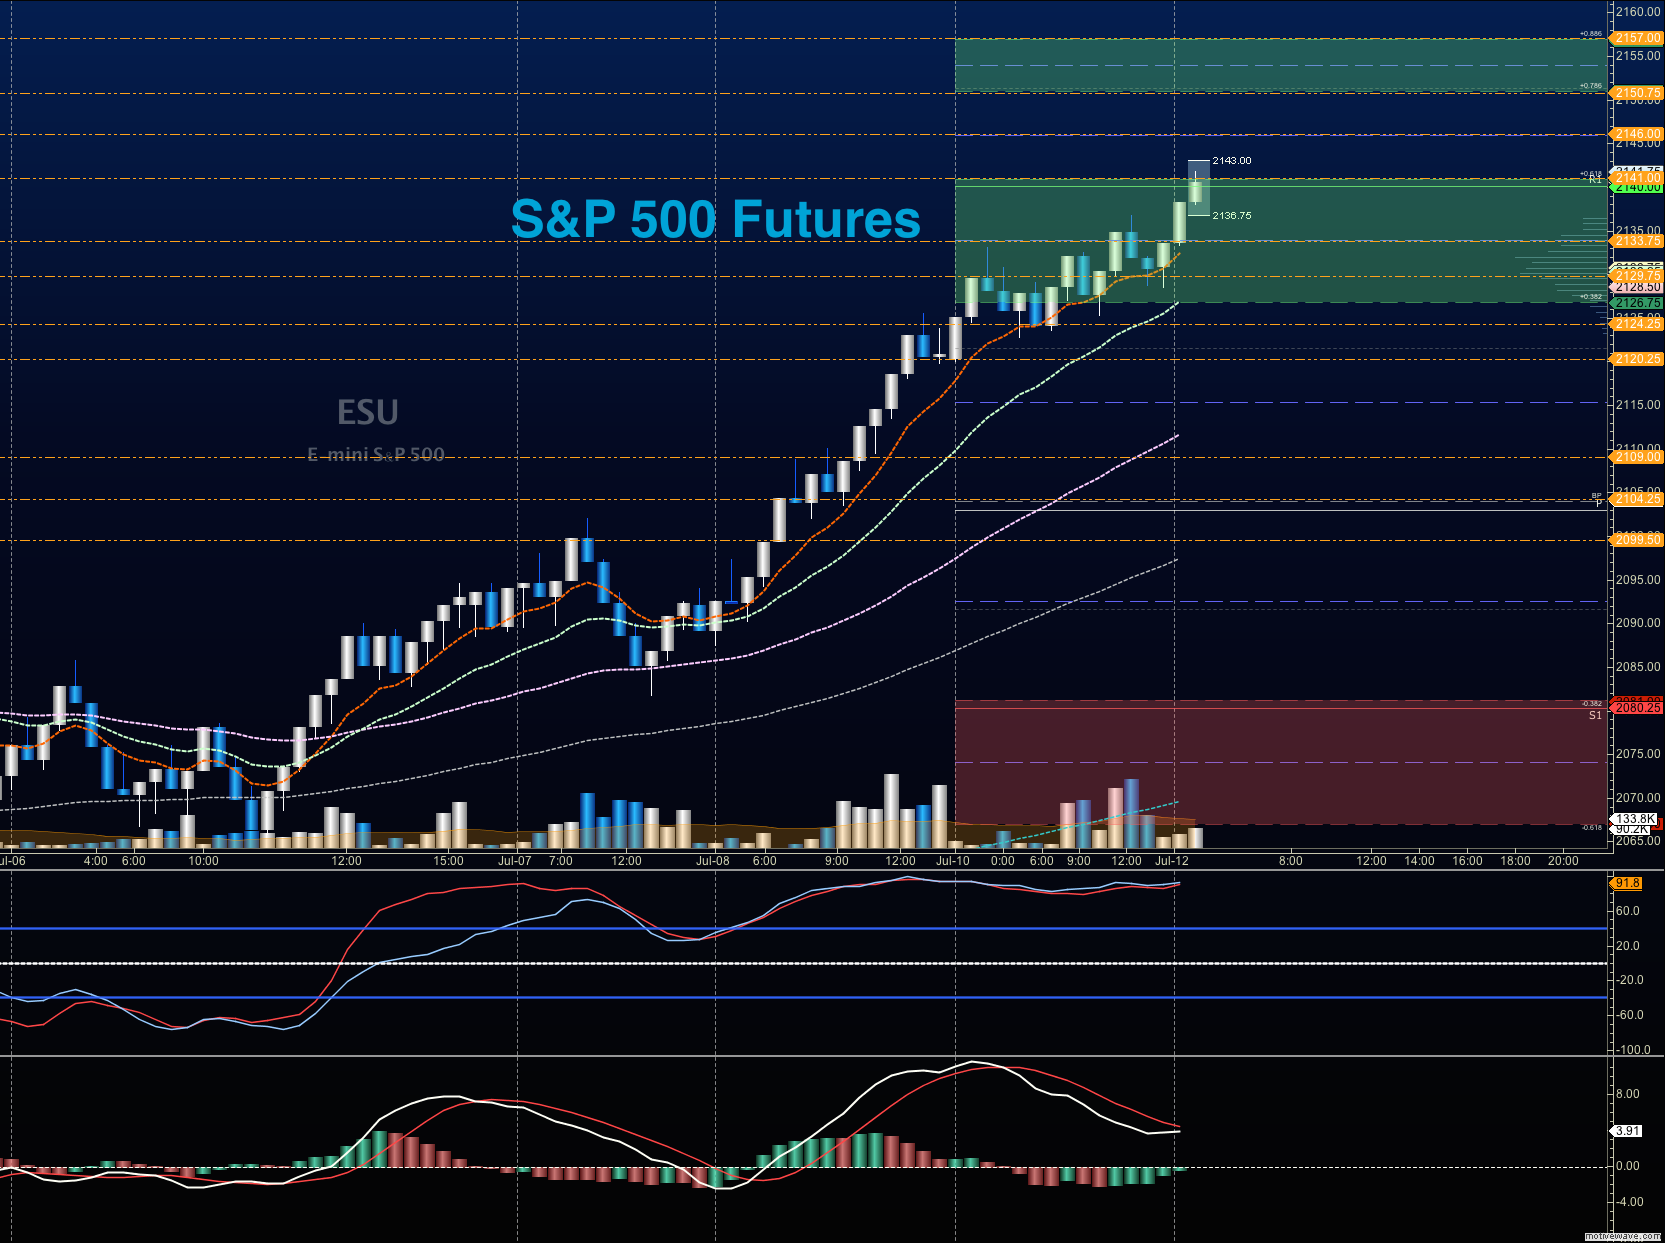
July 12 Stock Market Futures Trading Outlook – S&P 500 Futures (ES_F) –
Upside trades on S&P 500 futures – Favorable setups sit on the positive retest of 2141.5, or a positive retest of the bounce off 2134.75 with positive momentum. Be very careful watching for sellers showing up near 2140.5, as rejection of price there off the 2134.75 bounce entry could signal that sellers are collecting strength. I use the 30min to 1hr chart for the breach and retest mechanic. Targets from 2134.75 are 2136.5, 2140.5, 2143.5, 2145.75, 2147.25, 2150.75, 2153.5, and if we expand, we are likely to stretch above into 2157.5.
Downside trades on S&P 500 futures – Favorable setups sit below the failed retest of 2132 or at the first failed retest of 2140 with negative divergence. It is important to watch for higher lows to develop with the 2140 entry, as the chart will likely be working on a continuation upside. Retracement into lower levels from 2140 gives us the targets 2136.5, 2134.5, 2128.25, 2124.5, 2122.75, 2120, 2118.75, 2115.75, 2112.75, 2110.5, and 2107.75 to 2104.5, if sellers take over.
Have a look at the Fibonacci levels marked in the blog for more targets.
Nasdaq Futures
July 12 Stock Market Futures Trading Outlook – Nasdaq Futures (NQ_F) –
Nasdaq futures expanded with the rest of the markets and has retraced from a test just below the resistance level of 4580.75. Support levels to watch are near 4566.5, and a lower test near 4556. Resistance sits in a space between 4580.75 and 4590.75. It is important to note that the Nasdaq Composite (INDEXNASDAQ:.IXIC) has failed to breach its highs, at this time, and hence, is lagging in performance behind the S&P 500 Index.
Upside trades on Nasdaq futures – Favorable setups sit on the positive retest of 4576.75, or a positive retest of 4568.5 with positive momentum. I use the 30min to 1hr chart for the breach and retest mechanic. Watch for the lower high to develop near 4575, if sellers exercise more power intraday. Targets from 4568.5 are 4571.25, 4574.75, 4577.5, 4579, 4581.75, 4584.5, and 4590.75 to 4594.25, if buyers overpower the line of sellers in the way at 4558.
Downside trades on Nasdaq futures – Favorable setups sit below the failed retest of 4570, or at the failed retest of 4579 with negative divergence. Watch those moving averages and trend lines when taking the shorts. It is very countertrend here. Retracement into lower levels from 4579 gives us the targets 4574.5, 4571.5, 4568.25, 4566.5, 4563.75, 4561.5, 4557, 4552.5, 4546.5, 4542.75, 4540, 4538.25, and 4532 to 4528.75, if sellers resume control.
Crude Oil
July 12 Futures Trading Outlook – Crude Oil (CL_F) –
Note there is an API report after the close. Similar to last week, it seems like traders are buying crude oil into the likely draw that will be reported after the close today. Crude Oil and similar Oil ETFS (NYSEARCA:OIL) halted their downside drift, and are now near key resistance (46.15 on futures). Momentum remains bearish, but is lifting on intraday patterns particularly. The futures chart may have a tough time breaching 46.48.
The trading range on crude oil today appear to be 43.78 to 46.48 – but volatility continues to reign- meaning we could see stretches outside these regions easily.
Upside trades on crude oil can be staged on the positive retest of 46.15, or at a bounce off 45.53 with positive momentum. I often use the 30min to 1hr chart for the breach and retest mechanic. Targets from 45.53 are 45.74, 45.98, 46.14, 46.34, 46.48, 46.6, 46.9, 47.04, 47.32, 47.56, 47.74, and 48.14; if traders try once again to recapture 48.
Downside trades on crude oil can be staged on the failed retest of 45.4, or at the failed retest of 46.4 with negative divergence. Targets from 46.4 are 46.15, 45.94, 45.78, 45.58, 45.32, 44.89, 44.67, 44.48, 44.29, 44.02, 43.84, and 43.65, if selling really takes hold.
Visit TheTradingBook.com for more information.
If you’re interested in the live trading room, it is now primarily stock market futures content, though we do track heavily traded stocks and their likely daily trajectories as well – we begin at 9am with a morning report and likely chart movements along with trade setups for the day.
As long as the trader keeps himself aware of support and resistance levels, risk can be very adequately managed to play in either direction as bottom picking remains a behavior pattern that is developing with value buyers and speculative traders.
Twitter: @AnneMarieTrades
The author trades stock market futures every day and may have a position in mentioned securities at the time of publication. Any opinions expressed herein are solely those of the author, and do not in any way represent the views or opinions of any other person or entity.

: Creating Bullish Divergence?")

: Creating Bullish Divergence?")


