July 11 S&P 500 Futures Trading Outlook – The charts have expanded well outside their range for last week and are moving to all time highs on the S&P 500 Index (INDEXSP:.INX) as well as S&P 500 futures (ES_F).
There is a tremendous amount of buying strength, and that means pullbacks into support levels will be sure to find buyers. Those traders with a terminal bearish slant are having a tough time and today should be no different, as the appearance of weakness will likely be short lived. If upside action holds, we could be in a crab pattern pushing to higher prices. S&P 500 futures support levels lie near 2115.75 and resistance is near 2134. Remember, as the weight of momentum remains long, pullbacks will find buyers. The right side of the trade continues to be long but shorts into near term support levels could easily find traction, as there is some measure of technical divergence beneath the price action. Holding support will be key.
See today’s economic calendar with a rundown of releases.
RANGE OF TODAY’S MOTION
E-mini S&P Futures
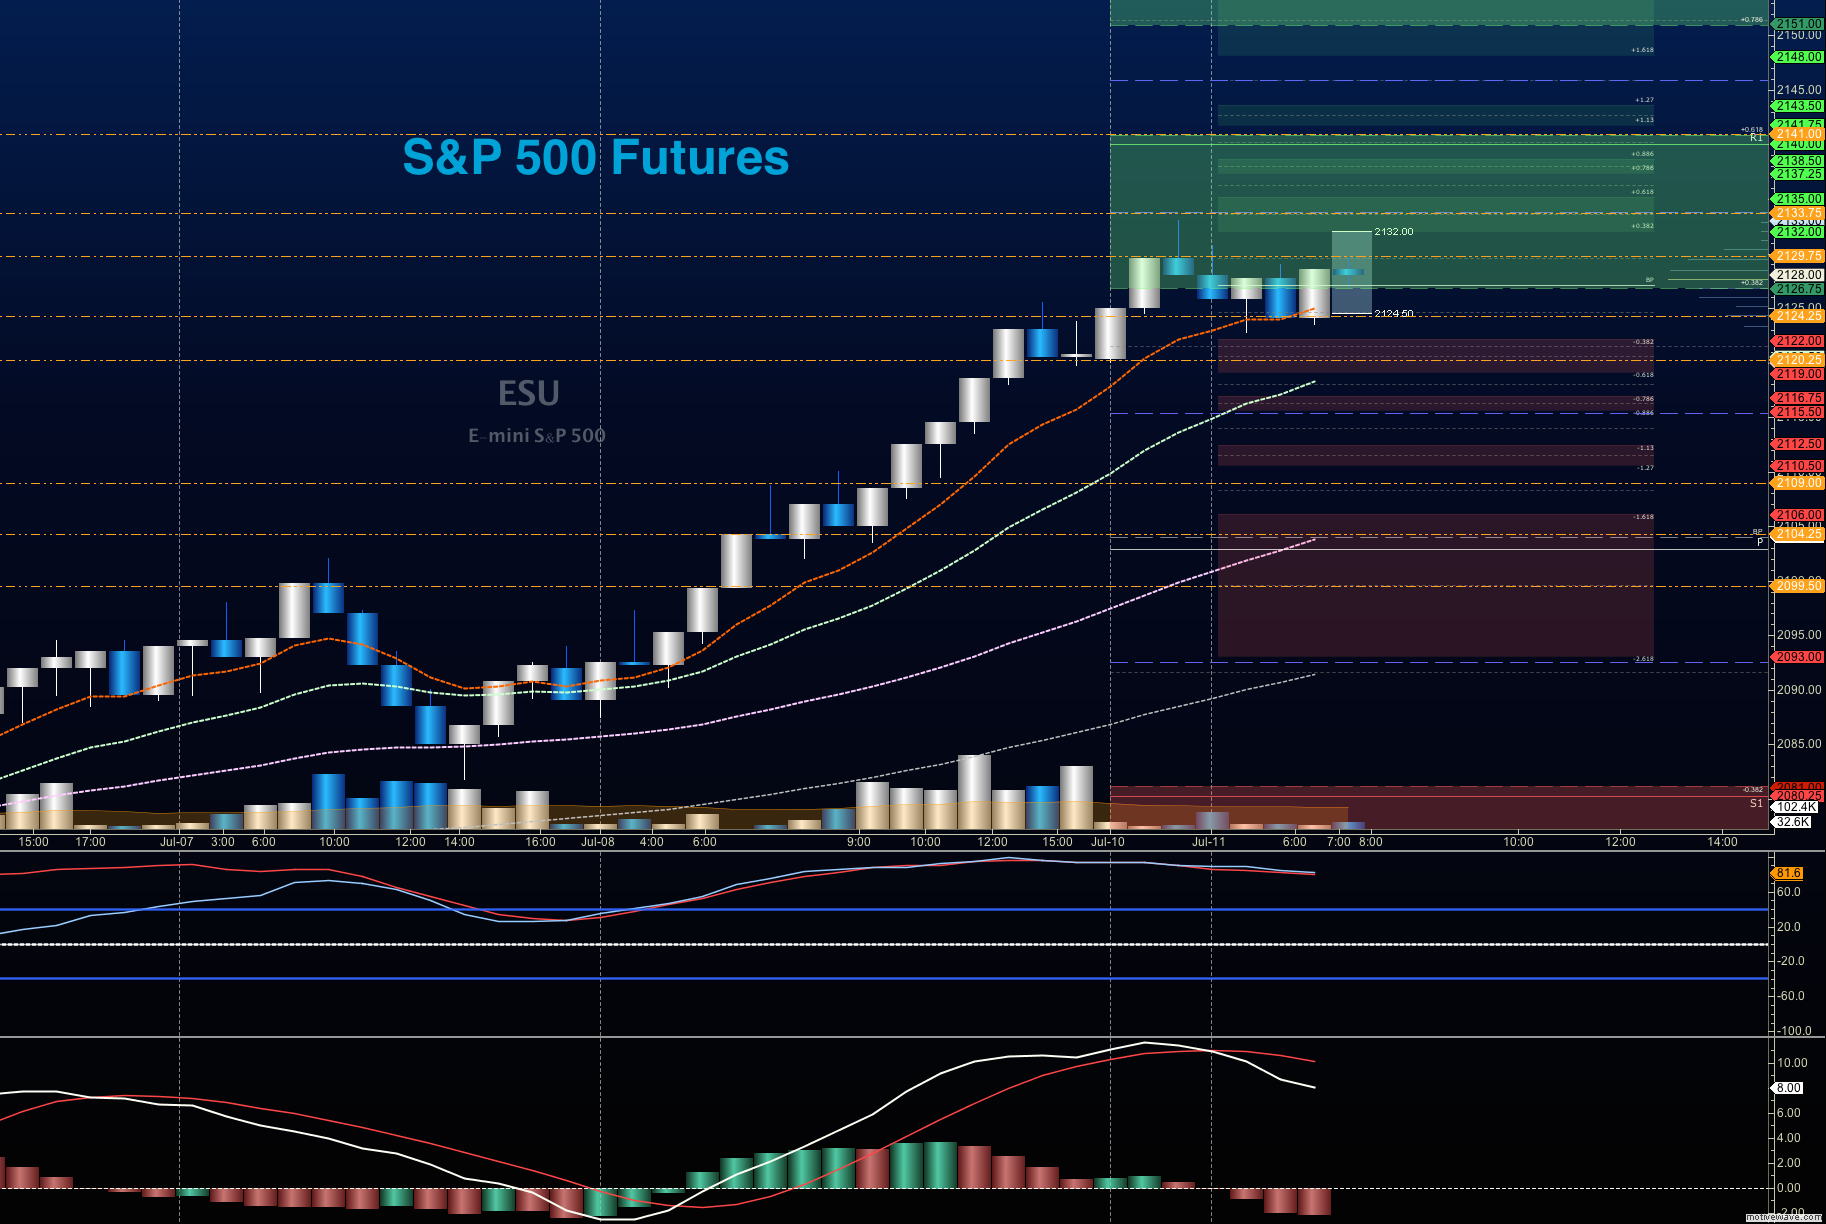
July 11 S&P 500 Futures Trading Outlook
Upside trades on S&P 500 futures – Favorable setups sit on the positive retest of 2120.5, or a positive retest of the bounce off 2115.75 with positive momentum. Be very careful watching for sellers showing up near 2120.5, as rejection of price there off the 2115.75 bounce entry could signal that sellers are collecting strength. I use the 30min to 1hr chart for the breach and retest mechanic. Targets from 2115.75 are 2118.75, 2120, 2122.75, 2124.75, 2128.25, 2130.75, 2133, and if we expand, we are likely to stretch above all time highs after a brief pullback into 2140.5, 2144.75, and perhaps 2150.5 into 2157.5.
Downside trades on S&P 500 futures – This would be quite countertrend at the moment, but favorable setups sit below the failed retest of 2122.25 or at the first failed retest of 2137.5 with negative divergence. It is important to watch for higher lows to develop with the 2137.5 entry, as the chart will likely be working on a continuation upside. Retracement into lower levels from 2137.5 gives us the targets 2134, 2128.25, 2124.5, 2122.75, 2120, 2118.75, 2115.75, 2112.75, 2110.5, and 2107.75 to 2104.5, if sellers take over.
Have a look at the Fibonacci levels marked in the blog for more targets.
Nasdaq Futures
Trading outlook for Nasdaq futures for July 11 (NQ_F) – Nasdaq futures have performed well also, but a clear line of sellers sit near 4558 today, and that will be the force to reckon with today. Support levels to watch are near 4508.5, and a lower test near 4502. Resistance sits in a space between 4545 and 4558.
Upside trades on Nasdaq futures – Favorable setups sit on the positive retest of 4536.75, or a positive retest of 4532.5 with positive momentum. I use the 30min to 1hr chart for the breach and retest mechanic. Watch for the lower high to develop near 4536, if sellers exercise more power intraday. Targets from 4532.5 are 4536.5, 4540.25, 4545, 4552.25, 4557.75, and 4580 to 4584.25, if buyers overpower the line of sellers in the way at 4558.
Downside trades on Nasdaq futures – Also very contrary to trend in this chart, favorable setups sit below the failed retest of 4526.75 or at the failed retest of 4538.5 with negative divergence and broken moving average support (not present at this time). Retracement into lower levels from 4538.5 gives us the targets 4536, 4532, 4528.75, 4521.75, 4519.5, 4515.75, 4512.5, 4508.5, and 4502 to 4498.75, if sellers resume control.
Crude Oil
Trading outlook for Crude Oil for July 11 (CL_F)
Crude Oil continues its downside drift, though with less acceleration than in prior days, amidst a mix of news that could sway price in either direction. A key target area for me near 44.48 was almost tested on Friday, but buyers showed up to hold this one above the level. Momentum remains bearish, and combined with the trend, it seems that big bounces should likely be sold as they have been over the past week. 48 will be the level to recover – so far, tests above this area have failed.
The trading range on crude oil today appear to be 43.78 to 46.4 – but volatility continues to reign.
Upside trades on crude oil can be staged on the positive retest of 45.6, or at a bounce off 45.07 with positive momentum. I often use the 30min to 1hr chart for the breach and retest mechanic. Targets from 45.07 are 45.35, 45.57, 45.74, 45.98, 46.14, 46.34, 46.6, 46.9, 47.04, 47.32, 47.56, 47.74, and 48.14; if traders try once again to recapture 48, though that seems very unlikely at this writing.
Downside trades on crude oil can be staged on the failed retest of 45.02, or at the failed retest of 45.96 with negative divergence. Targets from 45.96 are 45.78, 45.58, 45.32, 44.89, 44.67, 44.48, 44.29, 44.02, 43.84, and 43.65, if selling really takes hold.
If you’re interested in the live trading room, it is now primarily stock market futures content, though we do track heavily traded stocks and their likely daily trajectories as well – we begin at 9am with a morning report and likely chart movements along with trade setups for the day.
As long as the trader keeps himself aware of support and resistance levels, risk can be very adequately managed to play in either direction as bottom picking remains a behavior pattern that is developing with value buyers and speculative traders.
Twitter: @AnneMarieTrades
The author trades stock market futures every day and may have a position in mentioned securities at the time of publication. Any opinions expressed herein are solely those of the author, and do not in any way represent the views or opinions of any other person or entity.


