As a follower of the index futures intraday, one question I get asked frequently is, does my strategy apply to Stocks, ETF’s, Forex and can it be used on swing or long time setups. The simple and straight forward answer is YES.
In the example below, you will see that by applying a longer time frame, whether it be daily or range chart, offers multiple entry points with the same exact strategy used on an intraday chart.
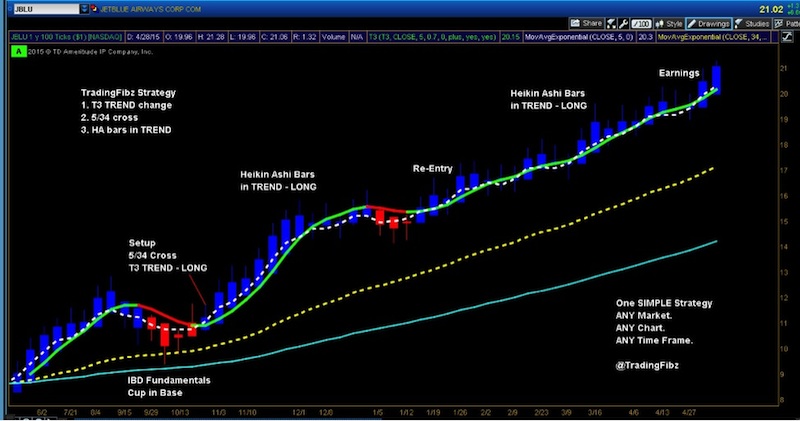
JetBlue (JBLU)
A solid earnings report on Tuesday lead the way to a nearly 7% rise in JetBlue stock, as seen here in the IBD market wrapup for April 28. Using a combination of strong fundamentals with my technical setups, makes for a stronger setup. Though JetBlue stock is not #1 in its sector group, the fundamental/technical setup of a Cup and Base back in October combined with the TradingFibz strategy made for an entry that would have kept you in with Heikin Ashi bars (also offering several potential re-entry points)
Here’s the chart of the uptrend with the initial setup highlighted back in late October, 2014 (100 tick range chart).
JetBlue Stock Chart (JBLU)
Thanks for reading.
Follow David on Twitter: @TradingFibz
The author has no positions in any of the mentioned securities at the time of publication. Any opinions expressed herein are solely those of the author, and do not in any way represent the views or opinions of any other person or entity.

: Worrisome to Broader Market?")


