Japanese equities have been strong since bottoming last October. The most visible sign of the Japanese markets is the Nikkei 225 Index. Its rally out of the October lows brought it to the 18,000 level in December. And it has approached this level two more times since, the most recent occurring over the past week. Seems this level has turned into stubborn resistance.
Why? Perhaps this level is more important than a simple short-term resistance/breakout level. The two charts below highlight the importance of this technical resistance level.
The first chart is the daily chart showing the three approaches. Will 3 times be the charm?
Nikkei 225 Stock Market Chart (Daily)
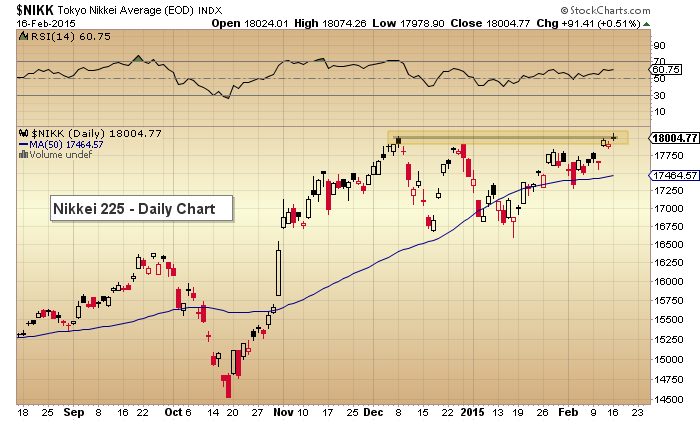
This is a nice chart for traders to monitor. But it becomes a bit more intriguing when we zoom out and look at a 20 year chart.
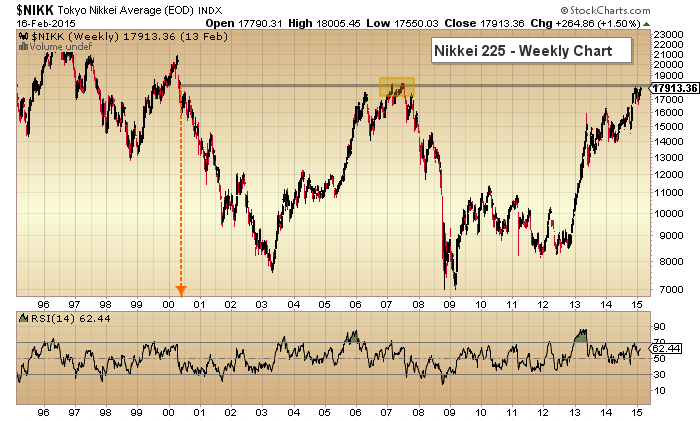
In the chart below, you can see that the Nikkei 225 is back at its 2007 highs. And a breakout above this level would push the index to levels it hasn’t seen in almost 15 year highs. And this could have longer-term technical implications as the Nikkei 225 looks for confirmation of its ’08/’09 bottom.
Nikkei 225 Stock Market Chart (Weekly)
Thanks for reading.
Follow Andy on Twitter: @andrewnyquist
No position in any of the mentioned securities at the time of publication. Any opinions expressed herein are solely those of the author, and do not in any way represent the views or opinions of any other person or entity.

: Worrisome to Broader Market?")

