As a follow-up to Friday’s post about Yen futures, here we show some areas for the ETF trader to watch.
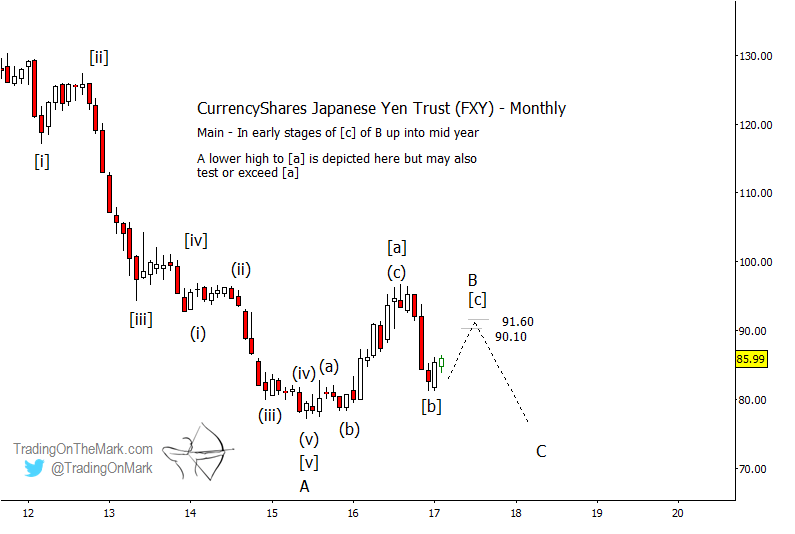
Charting the CurrencyShares Japanese Yen Trust (NYSEARCA:FXY), we had been expecting a decline from last summer into the support zone that was tested. Now we expect a modest but tradable rise that should last for several months.
If price is rising in sub-wave [c] of ‘B’ (Elliott Wave), as shown, then it might be possible for the fund to reach new highs above those of 2016. However, we think the more important resistance area is probably near 90.10 and 91.60, which would represent a lower high compared to last year.
Our main reasons for the more conservative expectation for a rally are (1) the cyclical timing we showed earlier for the Yen will probably kick in before FXY can reach a new high, and (2) the U.S. Dollar may begin breaking upward out of its own corrective elliott wave pattern during the next few months, which could put downward pressure on the Yen.
We’re also drawing up a weekly chart for FXY. Follow us on Twitter @TradingOnMark for that as well as additional charts and videos!
Japanese Yen ETF (FXY) – Monthly Elliott Wave Chart
Thanks for reading.
No position in any of the mentioned securities at the time of publication. Any opinions expressed herein are solely those of the author, and do not in any way represent the views or opinions of any other person or entity.

 Testing Important Price Support")
: Cup (and Maybe Handle) Watch")

