The Japanese Yen has responded well to the resistance levels we highlighted in our July 17 post.
And the price action since that date is a particularly good example of how a trader can position entries and stops when a reversal is expected.
In July, we indicated that the CurrencyShares Japanese Yen Trust (FXY) could press downward from its test of resistance near 89.24. (A similar level is drawn at 89.30 on the current chart.)
As of that writing, price had tested and retreated somewhat from the resistance area and was consolidating just above the trend line that marks the upper boundary of the Elliott wave triangle shown.
If a trader was looking to enter short, but price had already retreated from first resistance, that would suggest using a downward breakout to signal trade entry.
As you see below, price did not break beneath the trend line but instead went back to re-test and exceed first resistance. At this point most traders should still have been flat, or at worst have been stopped out near first resistance.
FXY then went on to test the second resistance we emphasized at 90.41, which provided another opportunity for short entry with tight stops. So far, that trade is working well.
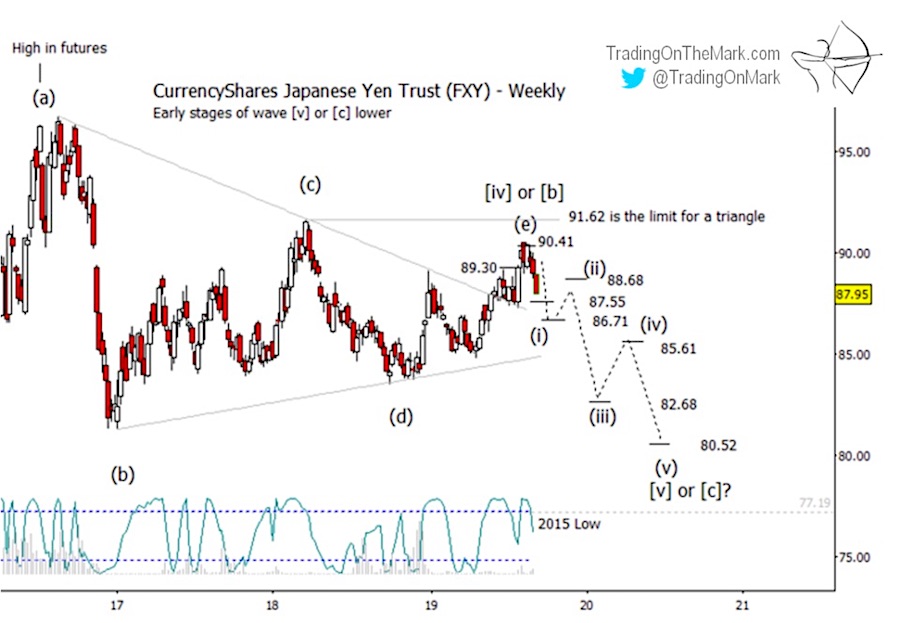
The rapid re-test of first resistance at 89.30 and the subsequent breakdown should encourage Yen bears to watch for signs of continuation. Next we would like to see FXY break beneath 87.55 and especially 86.71. The Fibonacci-related resonance level at 88.68 might also play a role as resistance if a bounce occurs soon.
The remaining levels on the chart at 85.61, 82.68 an 80.52 represent preliminary calculations for areas of possible turns. For now it makes sense to watch those levels in the context of FXY trying to make a five-wave impulsive move downward. We will be able to refine the levels after the impulse is a bit more mature.
As you might imagine, we are monitoring additional Fibonacci relationships and price cycles on the Yen futures chart, available at Trading On The Mark. The futures chart usually provides additional insights about where to watch for confirmation of a continuation move.
A Daily Analysis subscription at TOTM gives you constant access to up-to-date with charts on weekly and daily time frames for the Euro, the Dollar Index, gold, crude oil, bonds and the S&P 500. Intraday Analysis offers additional moment-by-moment coverage.
Did you know that every month we select one recipient of our free newsletter to win a four-week access package to our premium subscription service? The newsletter brings you even more charts and in-depth analysis to help with your trading. Request your free newsletters here!
Twitter: @TradingOnMark
The authors may have a position in the mentioned securities at the time of publication. Any opinions expressed herein are solely those of the author, and do not in any way represent the views or opinions of any other person or entity.

: Showing Some Signs of Emerging Strength")

