 Within hours after the Japanese Nikkei (Symbol: NKD) tipped into an official bear market last week, the index turned on its heels and screamed higher, advancing as much as 12.9% from last Thursday’s 12310 low to the 13895 high yesterday.
To put this in perspective, imagine seeing “Dow (symbol: DJIA) adds 1935 points in 3 days” roll across the scrolling ticker on CNBC.
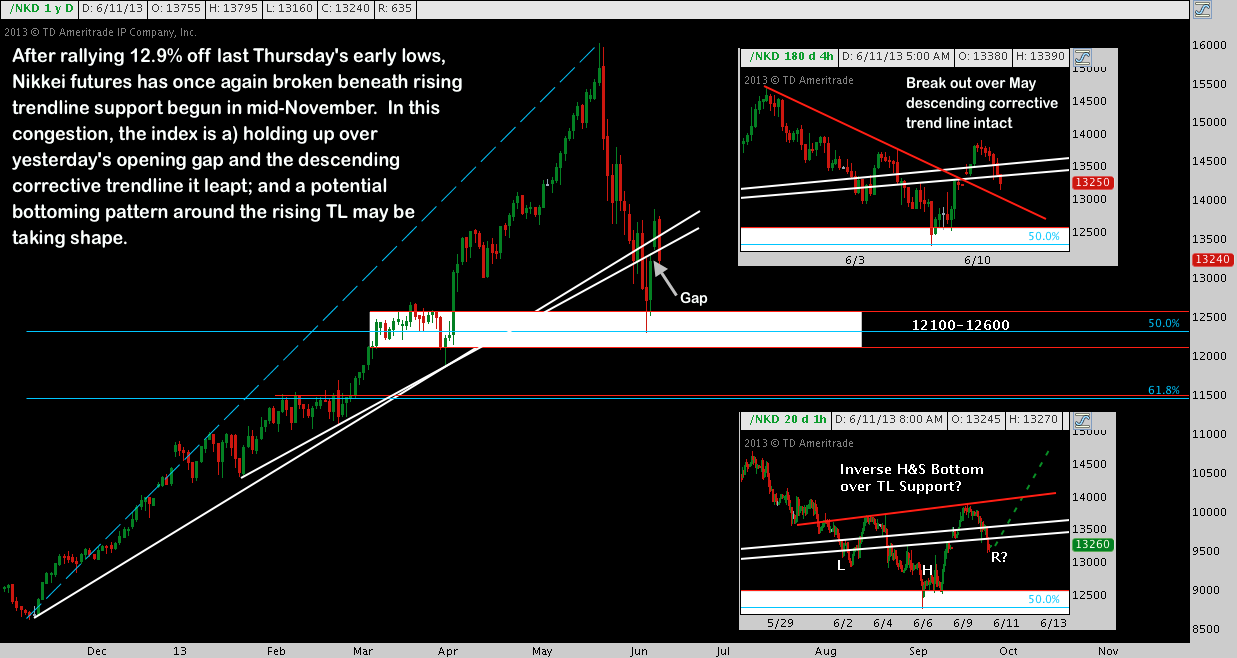
The area that halted the mid-week plunge of last Wednesday and Thursday was the 12100-12600 range (highlighted by the white horizontal band below) we pointed out as major support as the index bottomed . Not coincidentally, the 50% retracement of Nikkei’s mid-November low to the late-May high plots exactly in the middle of this range: check out how quickly it leaned down to brush this level before bounding off (click image to zoom):
Considering the range the Nikkei has put in over the last three weeks, major technical developments are occurring very fast: it’s as if we’re watching a year of activity on the Dow or S&P 500 (SPX) occur within a single month. So what’s new in the last few sessions?
- Last Friday touched upper end of the 12100-12600 range early, but faded that early down move and didn’t look back, lending added credibility to this support area. By the end of the day, the Nikkei had moved significantly higher, knocking on the door of the rising trend line it had lost 2 days previous.
- Monday saw an opening gap up over the resistance posed by the rising trend line, ultimately printing an even bigger advance than Friday. This candle caps the relief rally to-date with a swing high at 13895.
- Overnight (Tuesday, Tokyo time), the Bank of Japan’s (BOJ) Monetary Policy Committee concluded its latest meeting, announcing no additional policy measures. Whatever BOJ Governor Kuroda’s motives, JGB yields climbed, the Yen strengthened, and stocks sold off with Nikkei futures off -3.25% to 13315, losing the rising trend line once again.
The net result between this and last week’s activity is a short-term congestion zone in which the Nikkei is oscillating around its rising trend line. On the Daily timeframe, this can look all-but-meaningless even while its now evident the market still respects this line as support despite the volatility. On lower timeframes, though, we pick up a few helpful – and tentatively bullish – clues.
First: on the 4-hour chart above (top-right inset), the descending trend line (red) that has acted as resistance during this correction was also gapped over on Monday. As breakaway gaps go, this one is a modest disappointment given late Monday’s/Today’s decline; but that decline is also producing a gap fill and potential second-chance opportunity for long setups here.
And Second up: on the 4-hour and 1-hour chart (bottom-right inset), it becomes clear this “meaningless” congestion is a potential Inverse Head & Shoulders bottom that may be taking shape. How this setup will evolve is anything but certain; but as long as ~12600-12800 holds as the right shoulder is built out, the pattern remains a viable one, even if it doesn’t activate until a neckline break near 14000. With a 1500 point range, a completed measured move above the Inverse H&S neckline would test the correction’s 78.6% retracement near 15300, less than 5% below the recent 16020 high.
Twitter: @andrewunknown @seeitmarket
No position in any of the securities mentioned at the time of publication.
Any opinions expressed herein are solely those of the author, and do not in any way represent the views or opinions of any other person or entity.


