 Japan’s Nikkei 225 benchmark equity index sailed into bear market territory today (as we noted it might), crossing the “-20% from the high” threshold at 12816 and closing down 1.3% to 12720 after installing a 7.5% range on the day. On its low at 12310, Nikkei futures stood -23.2% off its 16020 high-water mark left just 11 sessions prior. Can we say “crash” yet?
The phrase “bear market” makes for a provocative headline – especially in a market unraveling as quickly as the Nikkei has – but now that it’s here: what does it really mean?
For one, we can reliably say that the “Monetary Policy as Inflationary Panacea” euphoria that set in after the Bank of Japan unveiled its much-hyped QE revamp at its April 3-4 meeting has been completely unwound. In a stark coincidence, today is not just “Nikkei = bear market”, but also the day on which the index 100% retraced the 4000 point move following the BOJ’s announcement early April.
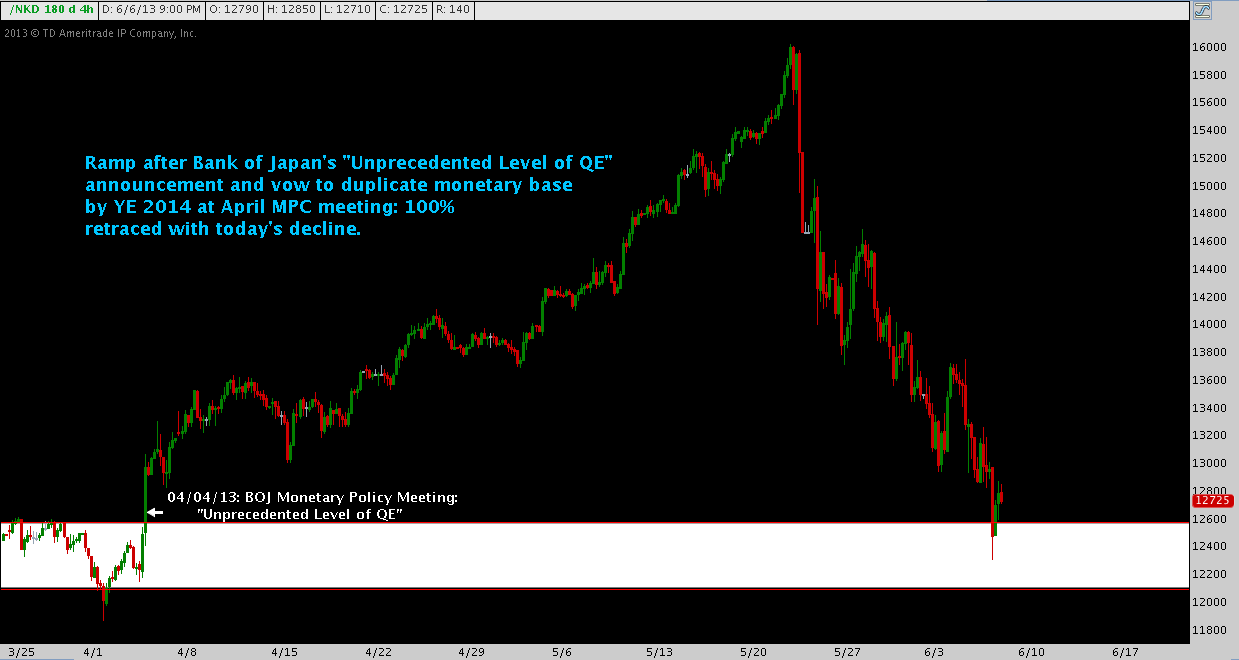
In retrospect, the Nikkei very quickly came to reflect a market price to perfection. But then, BOJ Governor Kuroda and Prime Minister Abe opened their mouths, and the illusion shattered. The above chart suggests that this “panacea” premium is substantially reduced: the quick-lived, BOJ-inspired bubble in certainty popped.
This all began when Abenomics-inspired optimism ignited the Nikkei’s rally from a low near 8600 back in the late Fall. The euphoria may be discounted, but that still leaves a 50% rally (8600-12700) intact. The activity of the last couple of weeks shouldn’t overshadow that the Nikkei is sitting on a massive gain put in during an aggressive uptrend set up across the 4.5 months from mid-November to early April.
There’s a deep crack (and that’s putting it kindly) in the foundation of that trend, though. No matter your drawing or interpretation of it, the rising trend line from the November bottom has been decisively broken.
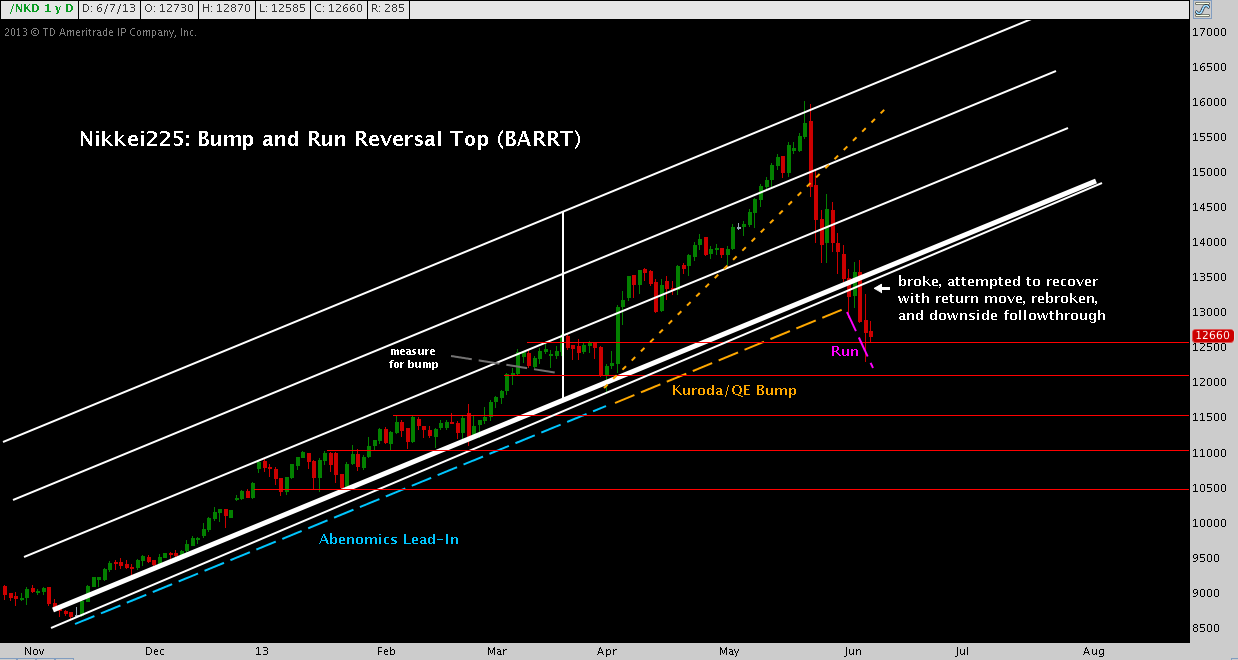
Here’s what I mean by “decisive” (refer to the purple “Run” segment above): the index closed below both rising trend line drawings (thick white line, and thin just beneath) Monday, but then recovered to just inside them on Tuesday, suggestive of demand at this key support level. However, the defense staged then was completely overwhelmed on Wednesday by a huge red candle not only decisively tossing aside support at 13400 but snapping 13000 as well. As we mentioned above, Thursday posted a comparatively mild decline (only -1.3%), unable to hold an early attempt to reach back into the 13000s.
In the end, the Nikkei’s rising trend line is broken, and all attempts this week to recover it swatted down.
The index is not without hope of support, however. Remember the thick white horizontal bar from the first chart above? That stakes out the 12100-12600 range put in place by the index in March, a 4% consolidation-and-pause as a) the preceding late February-early March +10% run digested and b) position squaring began ahead of the BOJ’s April 3-4 meeting.
Looking left now, we find a significant support zone in that 12100-12600 range – a support zone that held up well during the first move against it today. Below that, similar support rungs occur every 500 points or so. It’s also worth noting the Bump-and-Run pattern did tag its target at 12550 today.
Major technical damage then? Yes. Is the situation hopelessly begging for another huge leg down? Hardly.
Zooming out further, it becomes evident the Nikkei is no stranger to large moves – and like any other broad index, suffers occasional jarring, double-digit dislocations just like this one. What is atypical about the current environment is just how transparently price reflects the abrupt about-face and fast-unraveling of investor sentiment that prompted and has perpetuated the Nikkei’s drop. In the parlance of candlestick analysis, when this happens – as it did on the Nikkei in May – large “shadows” or “wicks” appear, indicative of a major shift in attitude in the middle the period. This produced an incredible example of what technician Martin Pring fittingly coined a Pinocchio Bar, a price exhaustion setup that often occurs at significant tops and bottoms (though hardly ever at this scale):
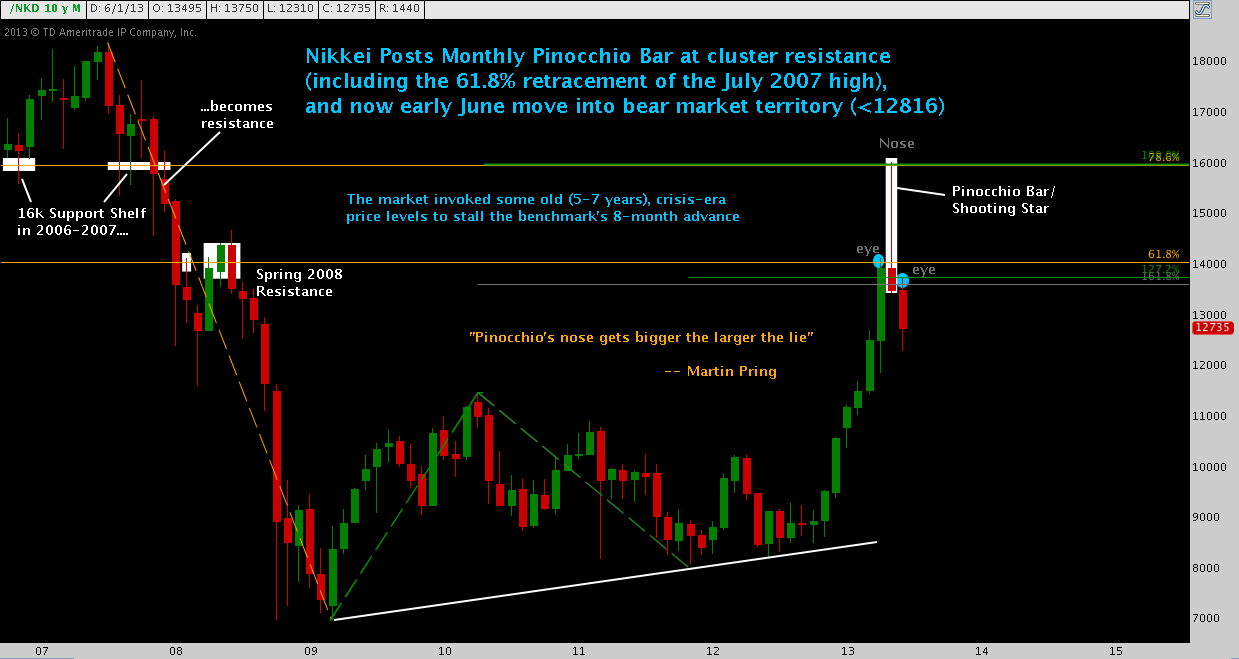
This chart gives little solace to the long side, suggesting the Nikkei remains closer to its reversal point near 13600 than final bottom and could easily chew right through 12100-12600 and every 500 point horizontal support level all the way back to 10000.
That, too, seems incredible; until you consider that 10000 still leaves the Nikkei up 20% since November.
Twitter: @andrewunknown @seeitmarket
No position in any of the securities mentioned at the time of publication.
Any opinions expressed herein are solely those of the author, and do not in any way represent the views or opinions of any other person or entity.


