The Transportation Sector ETF (IYT) houses airlines, railroads, shippers and truckers, to name a few.
Earnings on many of the biggest and most well known stocks in the Transportation sector are happening now and throughout next week.
For example, J.B. Hunt NASDAQ: JBH and United Airlines NASDAQ: UAL reported already. Both stocks have jumped in price and are now digesting those gains.
CSX Corp NASDAQ: CSX reported earnings as well. That stock also jumped in price but remains under the 200 daily moving average and resistance.
That makes me wonder about trucks, planes and cheap oil.
One of the largest US trucking companies Knight-Swift Transportation NYSE: KNX is expecting weaker earnings, reporting that overcapacity of big rigs is to blame.

Nevertheless, that might be priced in as that chart also looks decent.
Which brings me to the Transportation ETF (IYT), a reliable ETF for the transports sector.
Why should bulls focus on this sector into earnings season?
FedEx NYSE: FDX, IYT’s third largest holding will not report until December. Under the most pressure of the aforementioned companies, FDX is in a bearish phase.
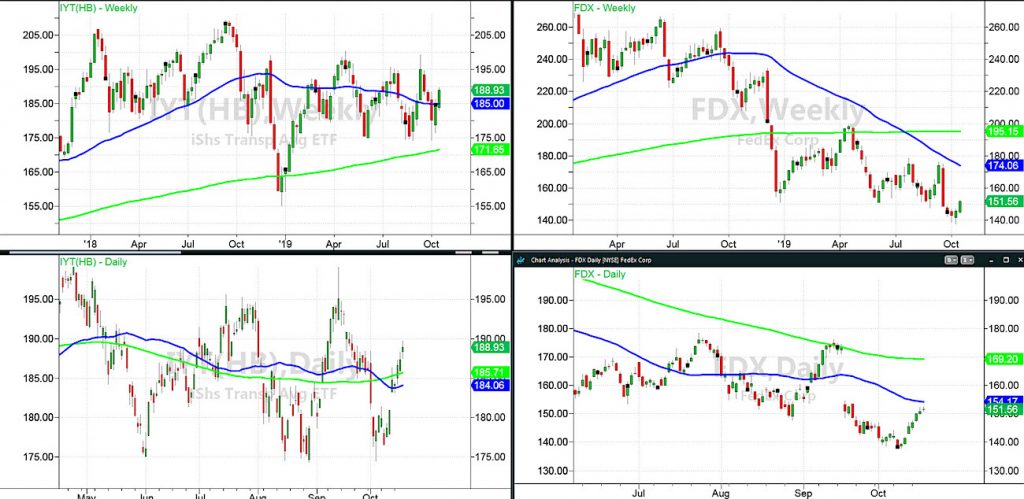
The daily chart on FDX shows the price climbing with the recent rally, but still under the 50-DMA.
On the weekly chart, FDX is also in a bearish phase and rather far from its 50-WMA.
On the left, IYT shows the strength this week has given it. The phase, accumulation, is positive and reflects optimism.
On the weekly chart, IYT has cleared the 50-WMA entering into a bullish phase.
The biggest weighted stock in IYT is Norfolk Southern Corp NYSE: NSC, which reports on 10/23 before the open.
NSC, like FDX only a bit stronger, trades slightly below its 200-DMA.
IYT now has support at 185-critical support.
The resistance level is 195-100.
If you compare this chart with the SPY one, it tells a completely different story.
Even with the move this week, considering the all-time high was hit in 2018 at 209 and change, the performance is more like a steam train running low on coal as opposed to the Fortune 500 stocks that have run high on cheap money.
SPY is near all-time highs. IYT has $10 or over 3 ATRs to go.
That is the disparity that worries me.
Will IYT catch up, or can it if SPY keeps running?
Will IYT fizzle, reflecting a weaker US economy?
As Johnny Cash sang,
I bet there’s rich folks eatin’
In a fancy dinin’ car
They’re probably drinkin’ coffee
And smokin’ big cigars
Well, I know I had it comin’
I know I can’t be free
But those people keep a-movin’
And that’s what tortures me
Also, you can watch my interview today with F.O.R.E.X. – click here.
S&P 500 (SPY) 296 is pivotal price support, 300 pivotal resistance to clear.
Russell 2000 (IWM) 153.35 (last week’s high) is a must clear/hold.
Dow Jones Industrials (DIA) 270 is now a must-hold.
Nasdaq (QQQ) 193.30 is pivotal price support, 194.71 closest resistance.
KRE (Regional Banks) 52.80 pivotal price support if this is to hold.
SMH (Semiconductors) Digesting which is fine. Needs to hold 121.00
IYT (Transportation) 185-190 range to clear.
IBB (Biotechnology) 102.50 is an important pivot price support, 105 is resistance.
XRT (Retail) 43-44 is huge price resistance, 41.50 support.
Twitter: @marketminute
The author may have a position in the mentioned securities at the time of publication. Any opinions expressed herein are solely those of the author, and do not in any way represent the views or opinions of any other person or entity.

: Worrisome to Broader Market?")
