S&P 500 ETF (SPY) Trading Outlook: Bullish
The S&P 500 has largely stalled out throughout much of December, but still shows no material weakness. I am keeping a vey tight leash on trading “longs” given the recent churning.
Under 362 on $SPY on a close would turn bearish for a move down to 350. A surge back higher is needed with good breadth right away to avoid the start of weakness
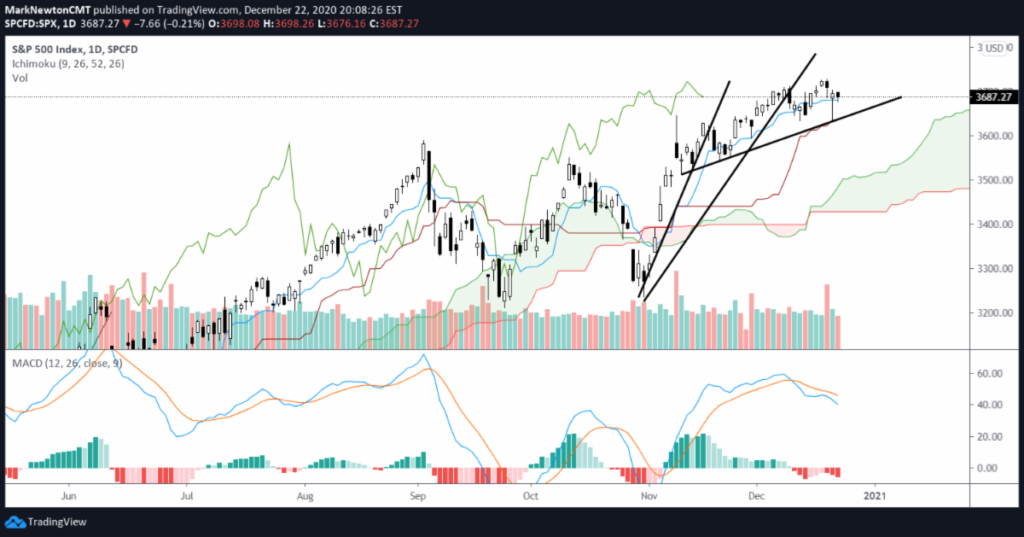
Trends recovered enough to not turn trends bearish, but yet we’ve seen a slowdown recently in breadth and momentum that really isn’t being touched upon by the broader media. A momentum divergence is now present as the push up into last week’s December 17th highs was not followed by momentum, and several sectors seem to have stalled out.
With this in mind, the big-Cap tech rebound of late is certainly helpful towards keeping trends up. Yet, markets really need to show a huge surge in breadth thrust and a big move up in participation sooner than later to avoid at least a minor correction. As the various trends connecting lows show in the chart above, the steeper trend has given way to a flatter trend in recent weeks. This isn’t bearish per se, yet SPY 362 cannot be broken without expecting a pullback down to 350. For now, the bullish trend will be intact until we see Tuesday’s intra-day lows broken.
If you have an interest in seeing timely intra-day market updates on my private twitter feed, please follow @NewtonAdvisors. Also, feel free to send me an email at info@newtonadvisor.com regarding how my Technical work can add alpha to your portfolio management process.
Twitter: @MarkNewtonCMT
Author has positions in mentioned securities at the time of publication. Any opinions expressed herein are solely those of the author, and do not in any way represent the views or opinions of any other person or entity.


