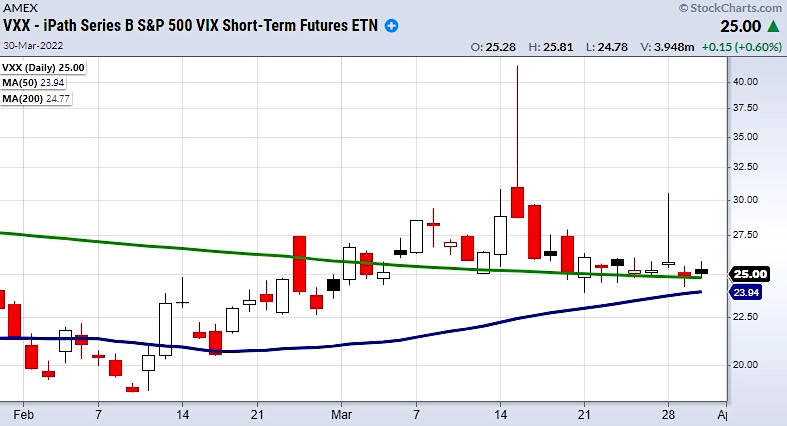
Recently we talked about the volatility fund standing its ground in price.
While the market has been trending higher, the short-term volatility fund S&P 500 VIX (VXX) was able to stay mostly over its 200-Day moving average near 24.
Then on Tuesday, many commodities rallied into the close.
These were hints to be cautious as the major indices pushed higher.
Additionally, the Russell 2000 (IWM) cleared a major resistance point making it look as though the market was ready to run.
While that still could be the case, IWM closing underneath its breakout level at $209 on Wednesday does not look good.
For traders heavily in equities does this mean they should reverse positions and go short?
Not completely since there are still key areas to watch for support and the indices have been due for a small pullback after such a quick run-up in price.
With that said, support levels are nearby in the Dow Jones (DIA) S&P 500 (SPY) and the small-cap index (IWM).
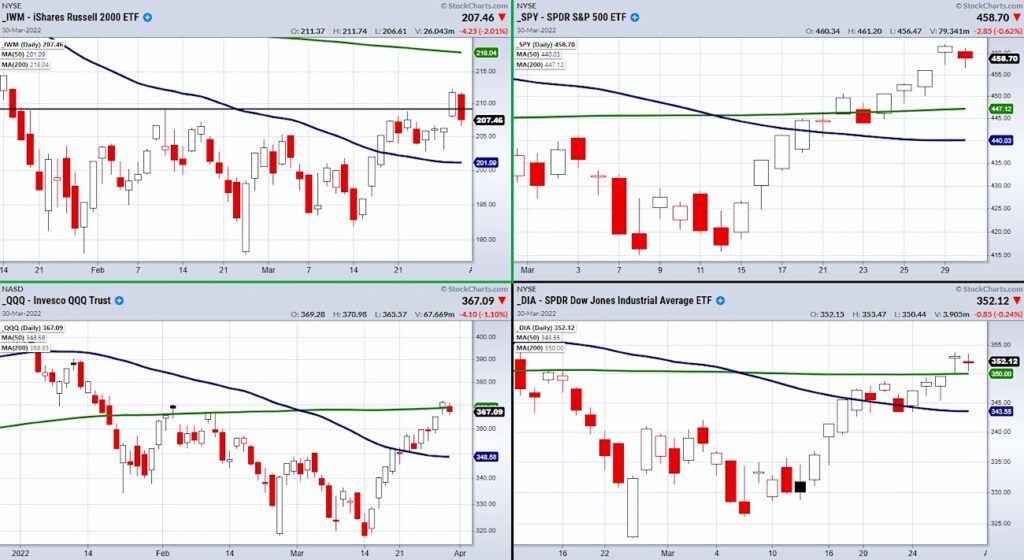
Most of the nearest support levels come from either the 50 or 200-DMA as seen in the above charts.
However, the Nasdaq 100 (QQQ) does not have much technical support until the $350 area.
While we can watch these support levels, the market is in a tricky spot.
We are sitting on the edge of looking for continuation higher as well as potentially falling back into the lower trading range.
Therefore, place trades carefully or watch for more clarity from these support and resistance areas based on the major moving averages.
Stock Market ETFs Trading Analysis & Summary:
S&P 500 (SPY) 447 is price support.
Russell 2000 (IWM) 209 is pivotal.
Dow Jones Industrials (DIA) 350 is price support to hold.
Nasdaq (QQQ) Could not hold the 200-day moving average at 368.83.
KRE (Regional Banks) With such a large selloff, watch for a close under the 200-day moving average.
SMH (Semiconductors) 268 is price support.
IYT (Transportation) Flirting with 274 the 200-day moving average.
IBB (Biotechnology) 127.67 is the 50-day moving average support.
XRT (Retail) 78.06 to hold from the 50-day moving average.
Twitter: @marketminute
The author may have a position in mentioned securities at the time of publication. Any opinions expressed herein are solely those of the author and do not represent the views or opinions of any other person or entity.


 Trading Into Inflection Point")

