While the focus for 2016 has been squarely on equities, China, and oil, gold has been an interesting market to follow for the beginning of this new year. Below I’ll be reviewing three charts for gold ($GLD) and sharing my insights into what’s been taking place in the price action… and what to look for to determine if the gold bear market is nearing an end.
Gold Prices – Monthly Chart
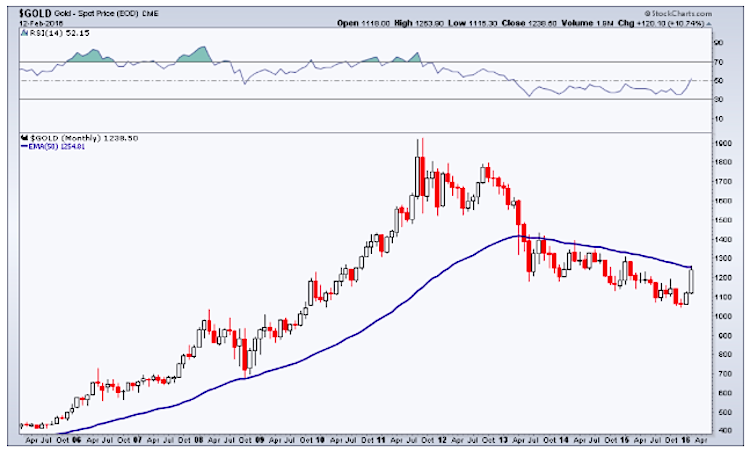
First up is the monthly chart for gold going back to 2005. I’ve included the 50-month Exponential Moving Average as well. While I typically use Simple MA’s more often, when looking at monthly charts with longer time frames being included in the average, an Exponential Moving Average can often provide a clearer picture, as it gives a stronger weight to the most current data.
As we can see in the chart below, the trend in price has been defined by the 50-month EMA, which has been a form of resistance since 2013 and is where gold prices are currently testing. I also would point out the level we’re at on the Relative Strength Index (RSI) – while this momentum indicator has confirmed the gold bear market by holding in a multi-year bearish range, it recently broke out to a new 3 year high.
Gold Prices – Weekly Chart
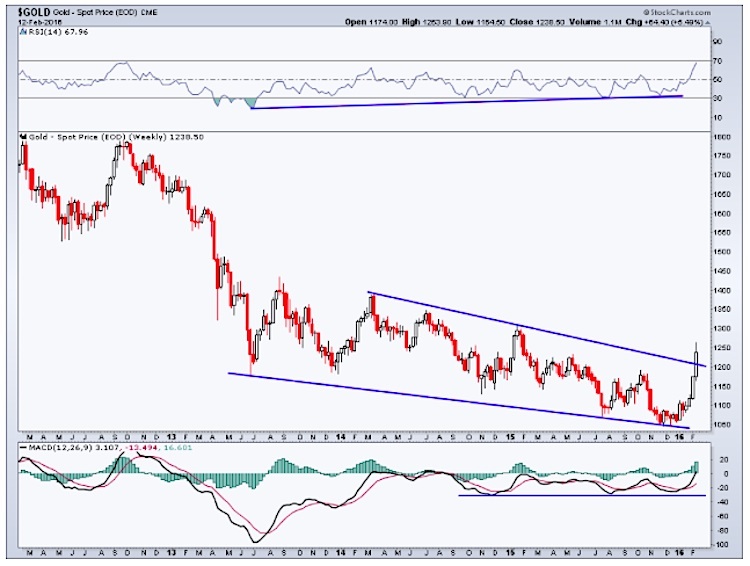
Next we have the weekly chart. Here we can see the nice bullish divergences that have been taking place in momentum on both the Relative Strength Index (RSI) and MACD indicators. The RSI made its low back in 2013 and has been making higher lows ever since. Meanwhile, the MACD has been in a range since 2014. Price has been in a declining channel as shown by the blue trend lines on the chart below. Last week we finally saw price break out from this channel as the RSI moved close to 70. Although the current price action by itself does not confirm an end to the gold bear market, the thrust higher is just what Gold bulls wanted to see. Now they just need follow through higher.
Gold Investor Sentiment
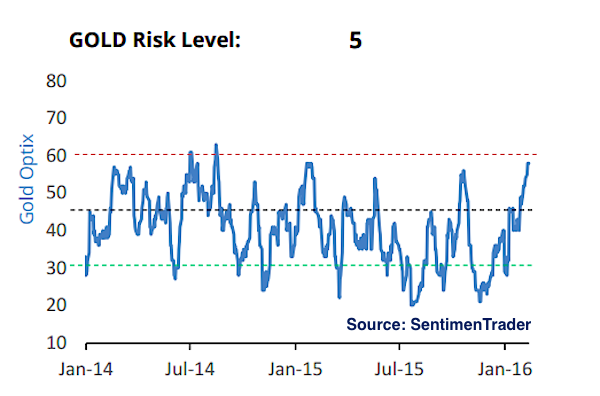
Finally, we have investor sentiment. The graph below comes from SentimenTrader and shows sentiment for gold since January 2015. As you can see, while we had been at pessimistically low levels not that long ago, gold traders have now moved this sentiment gauge near an extreme optimistic level. Jason at SentimenTrader put things nicely in his take on gold, “If gold is undergoing a long-term (six-month+) trend change, then we likely won’t see too much of a correction from here. But for the moment, the bear market is intact, and extreme optimism during a bear market is usually greeted with heavy selling pressure over a multi-week time frame.”
I agree with Jason in that we are at an important moment for gold in whether the long-term down trend and gold bear market is preparing to flip higher (and reverse trend). Going forward I’ll be watching to see how gold prices react to levels I’ve mentioned above (the resistance on the monthly and channel levels on weekly). I want to see how gold reacts around the $1300 level on the upside and we do get a pull back, if it respects prior resistance from the channel on the weekly chart.
The information contained in this article should not be construed as investment advice, research, or an offer to buy or sell securities. Everything written here is meant for educational and entertainment purposes only. I or my affiliates may hold positions in securities mentioned.
Further Reading From Andrew: “Bond Market Concerns Growing: A Peak Under The Surface“
Twitter: @AndrewThrasher
Read more from Andrew on his Blog.
Any opinions expressed herein are solely those of the author, and do not in any way represent the views or opinions of any other person or entity.


: Showing Some Signs of Emerging Strength")
