The coronavirus era has enjoyed higher stock prices, while also seeing higher energy and food prices.
This is an odd dilemma… often referred to as inflation.
It happens, yet often for different reasons. And right now we are seeing a wildly different set of reasons. We are living through a very difficult period in time. That said, let’s discuss the energy sector and the prospects of higher energy prices.
To do this, we need to examine the current price action and what it might mean for short-term investors. Let’s look at the charts.
Note that the following MarketSmith charts are built with Investors Business Daily’s product suite.
I am an Investors Business Daily (IBD) partner and promote the use of their products. The entire platform offers a good mix of analysts, education, and technical and fundamental data.
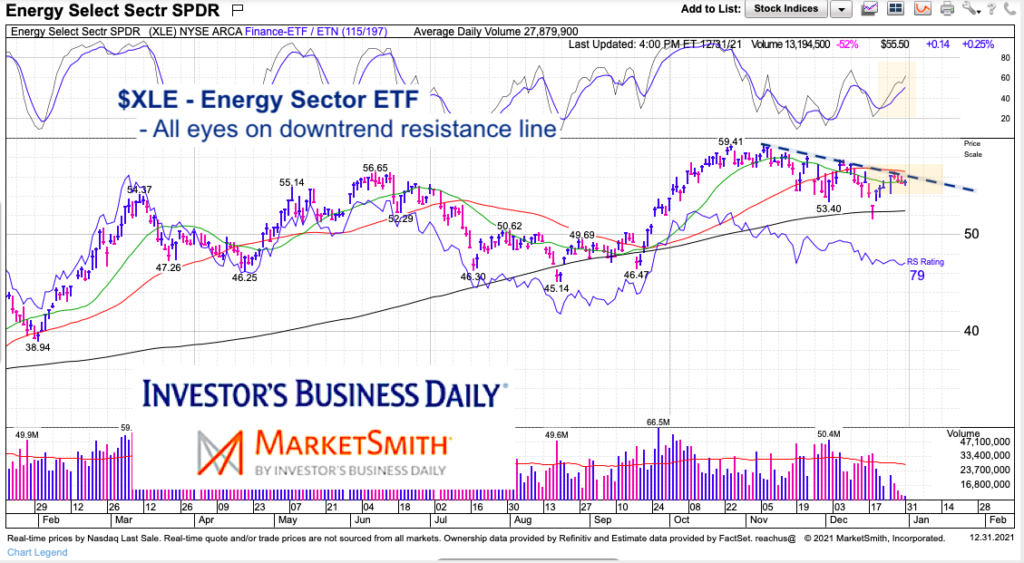
$XLE Energy Sector ETF Chart
The two month downtrend has seen plenty of volatility and perhaps scared out bulls. But the latest short-term rally higher has seen improved momentum and a retest of the current downtrend line.
A breakout over the down trend line is bullish, while a move lower is bearish. Easy as that.
Twitter: @andrewnyquist
The author may have a position in mentioned securities at the time of publication. Any opinions expressed herein are solely those of the author, and do not in any way represent the views or opinions of any other person or entity.


