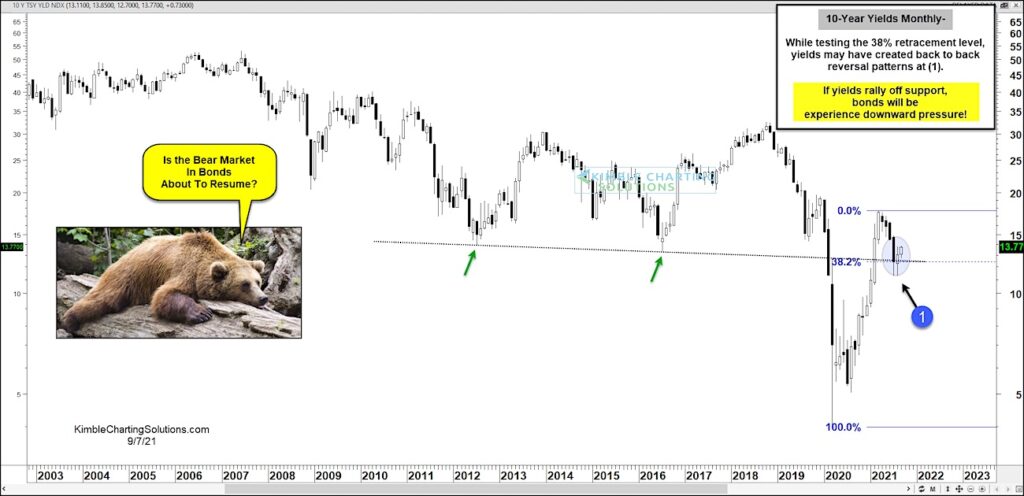
US Treasury bonds experienced a bear market and added selling pressure following the coronavirus flash crash as bond yields bottomed in early 2020 and took flight.
The move higher in yields peaked early this year, taking some pressure off bonds. But if yields should move higher once more, perhaps the bond bear market will resume!
We can see how this is possible when we look at today’s “monthly” chart of the 10-Year treasury bond yield.
Here we see the big rally that eventually peaked this spring. And when applying Fibonacci analysis, we can see that the 10-year bond yield is testing the 38.2 Fibonacci support area at (1). This is a big test of support for yields.
If yields rally from this Fib support level, then bonds will experience downward selling pressure. Stay tuned!
Note that KimbleCharting is offering a 2 week Free trial to See It Market readers. Just send me an email to services@kimblechartingsolutions.com for details to get set up.
Twitter: @KimbleCharting
Any opinions expressed herein are solely those of the author, and do not in any way represent the views or opinions of any other person or entity.
Editors note (September 8, 2021 at 10:34): The featured chart and similar text were updated to “10-Year” treasury bond yield, replacing “30-year” for accuracy.

: Showing Some Signs of Emerging Strength")
