The bull market in bond prices has steady, durable, and trustworthy. Over the past 40 years, if investors could count on anything, it was rising bonds and falling bond yields (interest rates).
But this trend / dynamic may be changing…
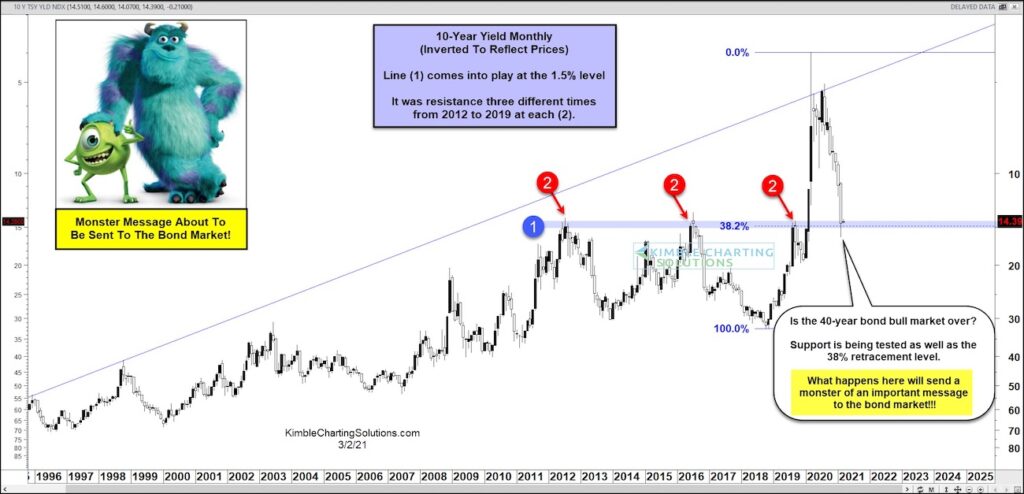
The post pandemic spike lower in interest rates (yields) sent bonds to all-time highs… but that quickly gave way to selling and steadily higher interest rates.
Is the bond market about to receive monster message?
As we have done many times before, today we share an “inverted” chart of 10-year US Treasury Bond Yields. This projects the image of bond prices…
As you can see, the 40 year bond bull market is facing a major support test at (2) at 1.5% yields. In summary, prior resistance at (2) is now major support. This support also happens to be a 38.2% Fibonacci level.
So this is a BIG level. What happens here will send a monster of an important message to the bond market! Stay tuned!!
$TNX 10-Year US Treasury Bond Yield “monthly” Chart (inverted)
Note that KimbleCharting is offering a 2 week Free trial to See It Market readers. Just send me an email to services@kimblechartingsolutions.com for details to get set up.
Twitter: @KimbleCharting
Any opinions expressed herein are solely those of the author, and do not in any way represent the views or opinions of any other person or entity.


: Creating Bullish Divergence?")


