One major theme of 2022 is the Federal Reserve raising interest rates to squash inflation. Case in point, the Fed raised rates another 75 basis points on Wednesday.
Will this be enough? What’s to come of interest rates?
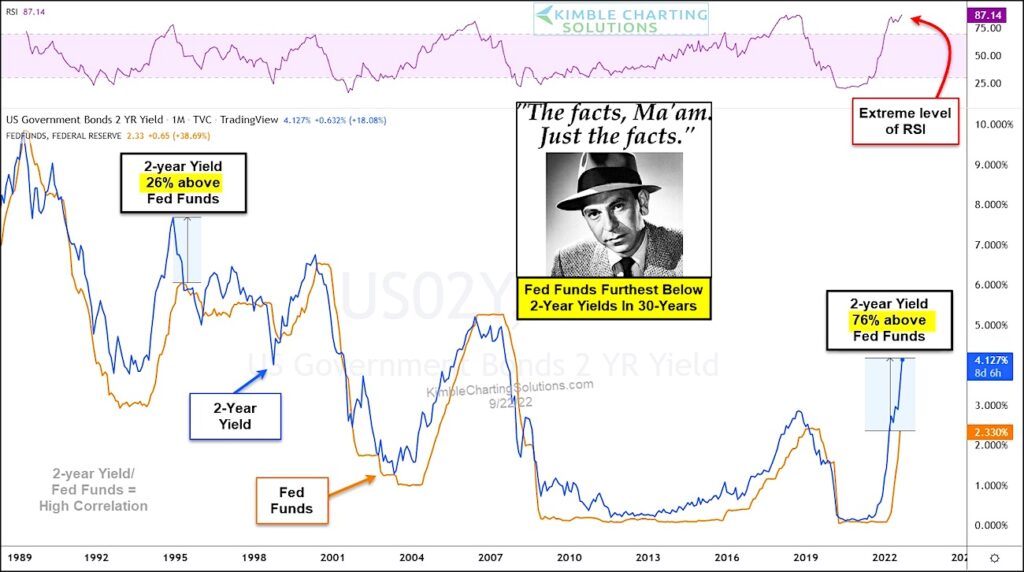
This brings us to today’s chart where we compare Fed Funds to the 2-Year treasury bond yield (a good short-term gauge of interest rates).
Joe Friday: “The facts, Ma’am. Just the facts.”
As you can see, the 2-year yield and Fed Funds have been pretty correlated over the past 30 years. Typically the 2-year yield leads Fed Funds on the way up and down.
But what happens when it reaches extremes? Because this is what we have today.
The 2-year Yield is trading at an extremely overbought level of RSI. It is currently 76% above Fed Funds! The next closest example over the past 3 decades was back in the 1990’s when it traded 26% above Fed Funds (before stalling out and heading lower).
If history is our guide, the 2-year yield may be nearing a top of some sort. At a minimum, the two gauges should see some mean reversion. If so, this could mean a slow-down in rising interest rates. Stay tuned!
2-Year Treasury Bond Yields vs Fed Funds Chart
Note that KimbleCharting is offering a 2 week Free trial to See It Market readers. Just send me an email to services@kimblechartingsolutions.com for details to get set up.
Twitter: @KimbleCharting
Any opinions expressed herein are solely those of the author, and do not in any way represent the views or opinions of any other person or entity.

: Worrisome to Broader Market?")

