The stock market continues to trade at elevated levels as traders ring in the first week of the new year.
But there are a few warning signs out there, including one we recently highlighted: the Nasdaq’s underperformance.
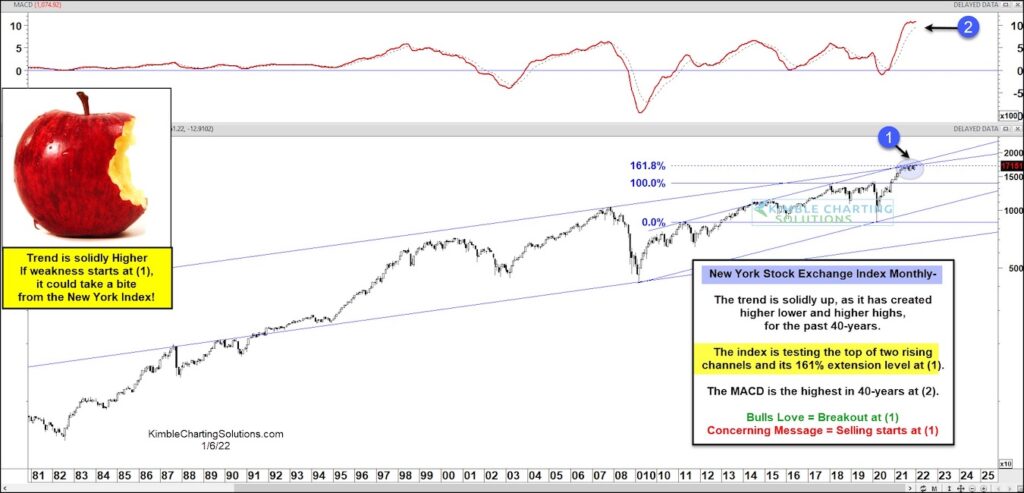
Today, we look at an important stock market index that is trading at an important level. Below we have a “monthly” chart of the New York Stock Exchange (NYSE Composite).
As you can see, the trend is solidly up, creating higher lows and higher highs for the past 40 years. But it is trading at a confluence of resistance, including the top of two rising channels and the 1.618 Fibonacci extension level off the 2020 lows at (1).
As well, the MACD indicator is at its highest level in 40 years at (2).
Clearly, bulls would love a breakout at (1). But they will get a little nervous if selling begins at the same price point. Stay tuned!
NYSE Stock Market Index “monthly” Chart
Note that KimbleCharting is offering a 2 week Free trial to See It Market readers. Just send me an email to services@kimblechartingsolutions.com for details to get set up.
Twitter: @KimbleCharting
Any opinions expressed herein are solely those of the author, and do not in any way represent the views or opinions of any other person or entity.

 Testing Important Price Support")
: Cup (and Maybe Handle) Watch")

