The concept of a “square out” is one of the most important in all of harmonic trading.
In this case, we believe that PRICE and TIME are the same thing. They are a NUMBER and they are intertwined. Say price makes a high (or low) of 50… then 50 seconds, 50 hours, 50 days, 50 degrees of planetary motion (time), etc. are spun out.
For the NYSE Stock Market Index we have a BIG square out approaching.
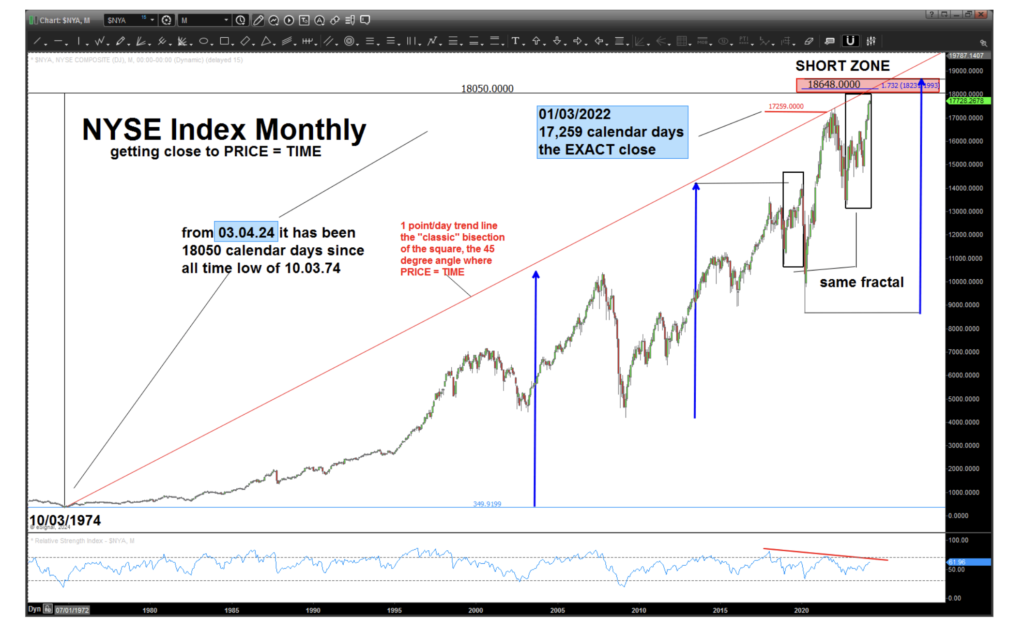
The all time low on the NYSE Index was on 10/03/1974. That was, from tomorrow, 18050 calendar days ago.
18050-17728 (Friday’s close) = 322 points.
We are 322 points away from a HUGE square out of PRICE and TIME.
Take note of the last “big high” about 2 years ago … in that case, the market closed at 17,259 which so happened to be EXACTLY 17,259 calendars from the all time low. That is the significance of the red trendline – it’s the 45 degree angle and 1:1 or 1 point/day trendline. We REALLY want to NYSE Index to climb another 300 points to tag that red trend line … perhaps that happens mid-late next week.
Additionally, we have pretty large bearish divergence on the MONTHLY RSI and we have the same “fractal” pattern that existed in the move before the 2020 thump.
Then, just a little bit higher we have the measured moves which have been responsible for EVERY UP MOVE since the beginning of this index.
I sense/ believe, we are getting very close to a top (maybe THE top but I sense “A” top)…
NYSE Stock Market Index “Monthly” Chart
You’re probably aware the fear and greed sentiment indicators are thru the roof w/ extreme greed and then “Mr. Reliable” shows up … the “magazine cover indicator”
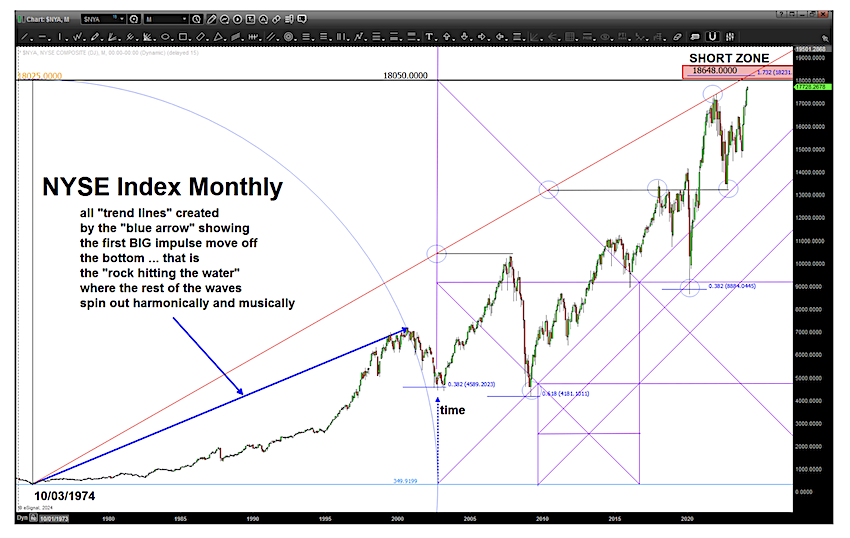
Last, here’s the geometry of the NYSE Index derived from the BIG MOVE off the low from 1974.
On this chart you will notice I put the “retracements” at the lows of 2002, 2009 and 2020 using the “node” of the all time low. The reason I do this is to check and see (Ronald Regan – TRUST but verify) if this is a significant node. As you can see, drawing the retracement grids using the all time low as near perfect.
2002 = .382 retracement
2009 = .618 retracement
2020 = .382 retracement.
This is a good number …how good?
Well, 350*51.50 = 18, 025 which so happens to be the exact angle of the Great Pyramid of Giza. Just saying. 😉
That vector (blue arrow) represents the “rock hitting the water” and creates the harmony and music …
NYSE Index “monthly” Chart
And, of course, all this means is it could very well blow thru this level and take off parabolically.
I’m not there… yet.
Be sure to check out my unique analysis of stocks, commodities, currencies over at Bart’s Charts. Stay tuned and thanks for reading.
Twitter: @BartsCharts
Author does not have a position in mentioned securities at the time of publication. Any opinions expressed herein are solely those of the author, and do not in any way represent the views or opinions of any other person or entity.

: Cup (and Maybe Handle) Watch")
 Trading Near Top Of Price Range")

