Then about a year later I was back on with Jeff and continued to pound the unpopular call of the Volatility Index (VIX) staying beneath its long-term average for years.
It is obvious now, but this really was the most hated bull market in stocks of all-time. The fear mongering and constant backward thinking warped the minds of many investors and, unfortunately, they missed out on record gains in the stock market.
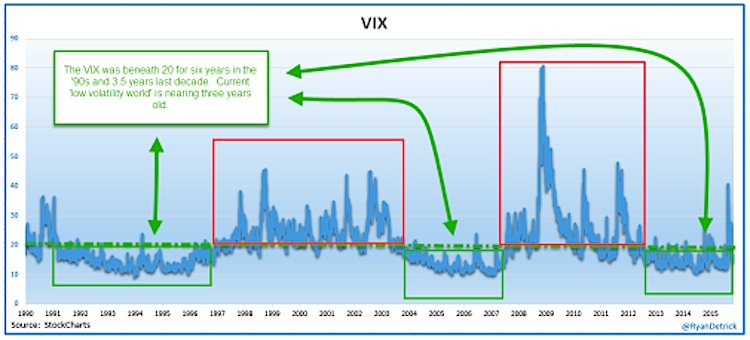
Here’s the one chart I’ve been sharing for more than three years as to why the VIX (and broader market volatility) could stay low. The bottom line is the VIX tends to stay above or below the 20 level for years each decade. For six years in the ‘90s and three and a half years last decade saw a ‘low volatility world.’ The years in between saw massive vix spikes.
Now things are more difficult. We saw a VIX spike clear up to 50, but just as quickly the VIX imploded back to the mid-teens. My take is we could be in about the 6th or 7th inning of the ‘low volatility world’ – but it still has legs. I wouldn’t be shocked at all if we looked up in six months and the VIX stayed beneath the 20 level that entire time.
Thanks for reading.
Twitter: @RyanDetrick
Read more from Ryan on his tumblr.
Any opinions expressed herein are solely those of the author, and do not in any way represent the views or opinions of any other person or entity.


: Showing Some Signs of Emerging Strength")
