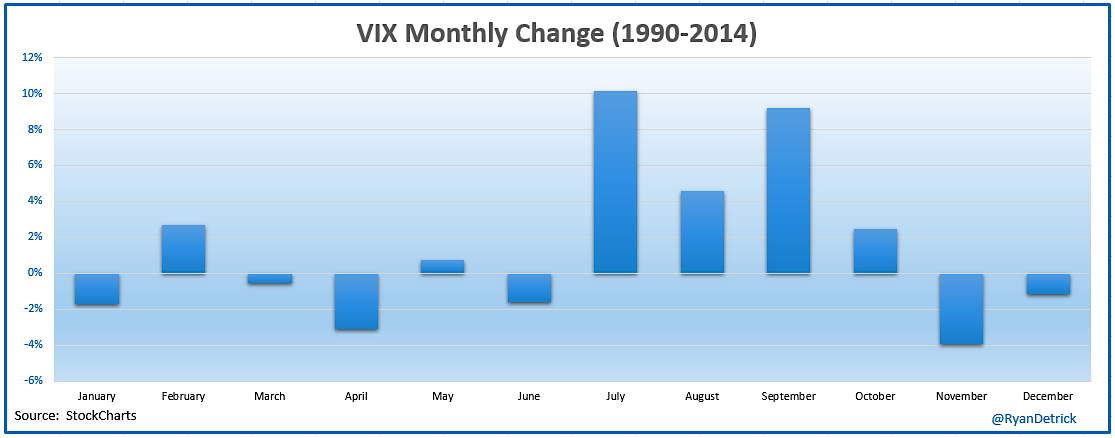
The S&P 500 fell nearly 1% yesterday and the CBOE Volatility Index (VIX) jumped nearly 15% (almost 20% at one point intraday). This got me thinking about taking a closer look at everyone’s favorite fear gauge – the VIX. First things first, seasonality wise, the next two months tend to see a muted move in market volatility.
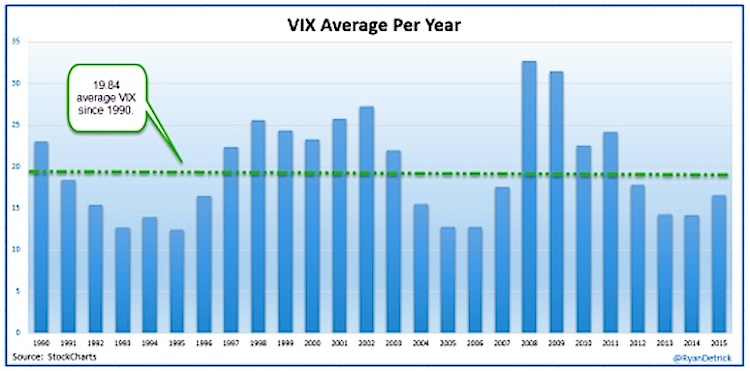
Even after the big swings in equity prices and market volatility we’ve seen since late August, it is worth noting the VIX has averaged just 16.53 in 2015. This is the fourth straight year beneath the long-term average of about 20. For years we’ve been hearing about higher market volatility coming. It hasn’t happened yet.
If you’ve followed me for years, then you know I’ve long been in the camp that market volatility will stay relatively low – potentially for years. Fortunately, that has played out well. I’ve never seen as much hate for a call as when I started saying the Volatility Index (VIX) would stay low for years back in early 2013. That was a clue I was on to something big.
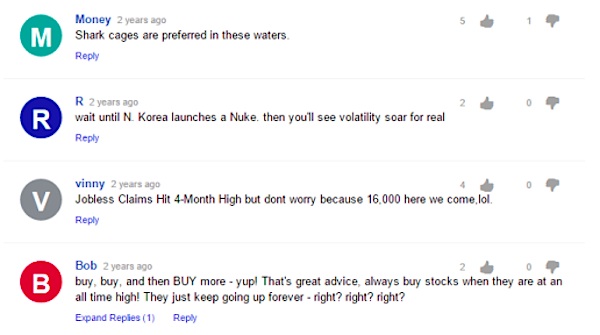
Here is a spot I did with Jeff Macke on Yahoo in early 2013 on why the VIX would stay low for years. Check out the 131 comments to get a feel for just how outrageous the idea of this was to most average investors. I cut out a few for a sample of what most were thinking back then.
continue reading on the next page…


: Showing Some Signs of Emerging Strength")
