Before major market pullbacks, it is common to see internal market disconnections or divergences. And they often go on for much longer than investors think they will.
Today we look at high yield junk bonds and when this asset diverges from the broader equities market. It’s normal for junk bonds to perform well when stocks are heading higher as it’s a sign of “risk-on” (investors willing to take risks).
However, when junk bonds diverge and underperform while the stock market heads higher, it can be a warning sign that “risk-on” is fading.
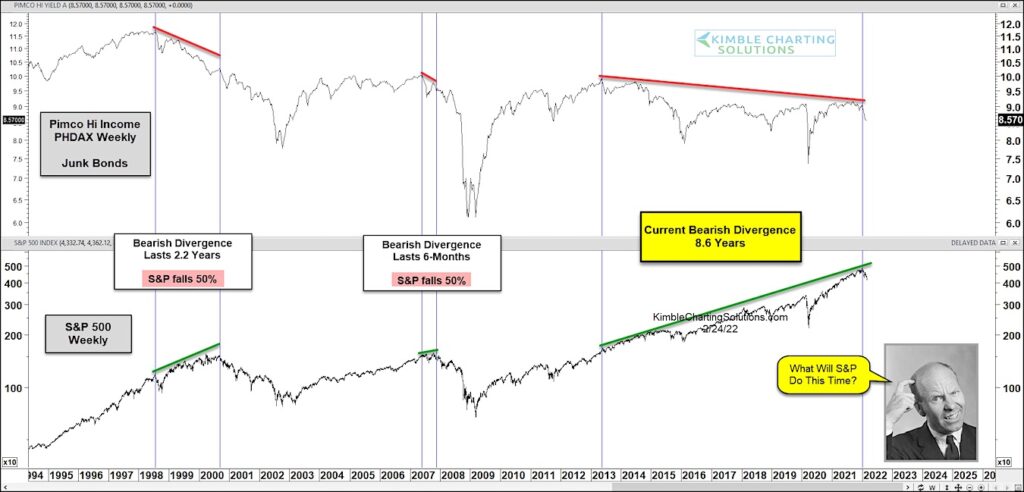
Before the 2000 stock market crash, high yield bonds created a bearish divergence that lasted 2.2 years. Then in 2007, they created a 6 month bearish divergence before the market cracked.
Well, looking at the chart below we can see an 8.6 year bearish divergence. Yikes! Wonder what the S&P 500 will do next? Or perhaps is in the process of doing (turning lower?). Stay tuned!
PHDAX Pimco High Income Fund vs S&P 500 Chart
Note that KimbleCharting is offering a 2 week Free trial to See It Market readers. Just send me an email to services@kimblechartingsolutions.com for details to get set up.
Twitter: @KimbleCharting
Any opinions expressed herein are solely those of the author, and do not in any way represent the views or opinions of any other person or entity.


: Showing Some Signs of Emerging Strength")
