Throughout modern financial history, the ability to borrow at a 5% rate on a 30-year mortgage was considered a great deal.
Over the past ten years, mortgage rates falling to between 3% and 4% have warped perceptions.
Evidence of this fact can be found by the sticker shock and home buyer consternation that the currently available 5% mortgage rate is causing. The rate shock is not limited to home buyers; the homebuilding sector has fallen over 30% since it recorded a record high in January 2018.
Notably, a month before hitting that record, the popular SPDR S&P Homebuilders ETF (NYSEARCA: XHB) surpassed the previous record high established at the peak of the housing bubble in 2006.
Mortgage rates play a large role in housing affordability, which greatly affects housing sales and prices, economic growth and the profits or losses for those involved in the housing sector.
We discussed and quantified housing affordability dynamics in our article, The Headwind Facing Housing. In this article, we consider whether the housing sector has fallen far enough to warrant investment consideration.
Headwinds Redux
In The Headwind Facing Housing,we produced two graphs that quantify the effect varying mortgage rates have on housing affordability. We modified those graphs, as shown below, to highlight how recent changes in 30-year mortgage rates have affected mortgage payments and housing affordability.
Check out my new service with a 14 day free trial period over at RIA Pro.
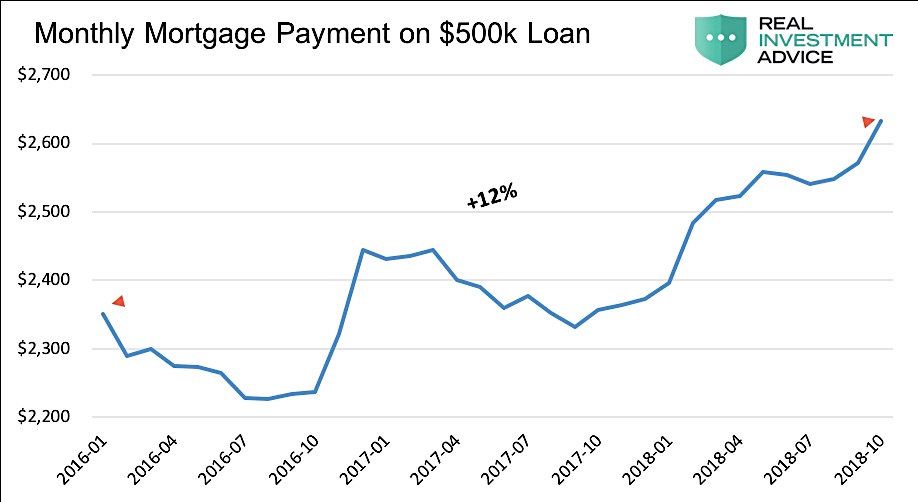
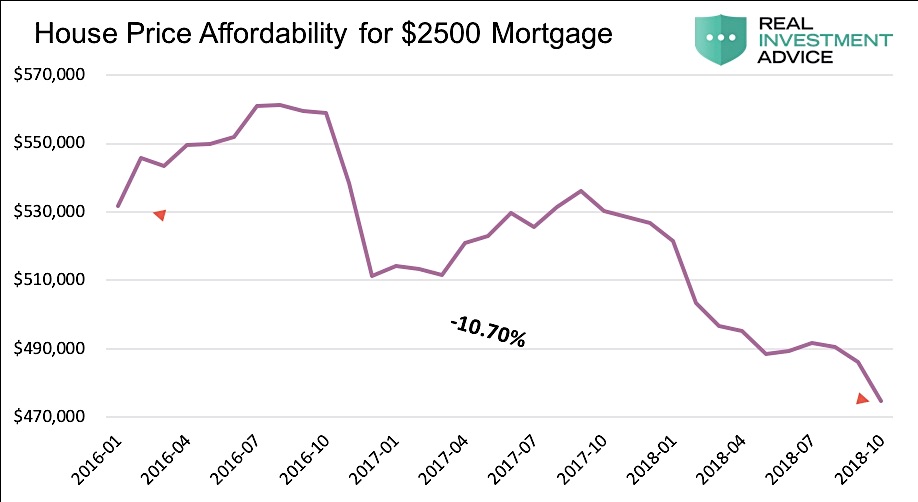
In the first graph, the monthly mortgage payment (excluding taxes, insurance, and other fees) for a buyer purchasing a $500,000 house has risen 12% since 2016. The second graph illustrates the purchase price a buyer can afford for a fixed $2,500 mortgage payment. Since 2016, the purchase price has dropped from $530,000 to almost $470,000. The data in both graphs are based on 30-year mortgage rates rising from 3.87% in January 2016 to 4.83% as of the most recent data from the Federal Reserve.
Effectively, as the graphs show, a 1% rise in mortgage rates reduced affordability and increased monthly mortgage payments by about 10-12% in the current environment.
Higher mortgage rates dictate that buyers either take on larger mortgage payments or buy cheaper houses. The burden of higher rates does not solely fall on buyers; it also hurts sellers and those in the housing construction business.
Home Builders ETF (XHB) and Broader Sector
Equity investors appear to be keenly aware of the toxic relationship between mortgage rates and homebuilder profits. The graph below compares the year to date price return for the S&P Homebuilders ETF (XHB) and the S&P 500.
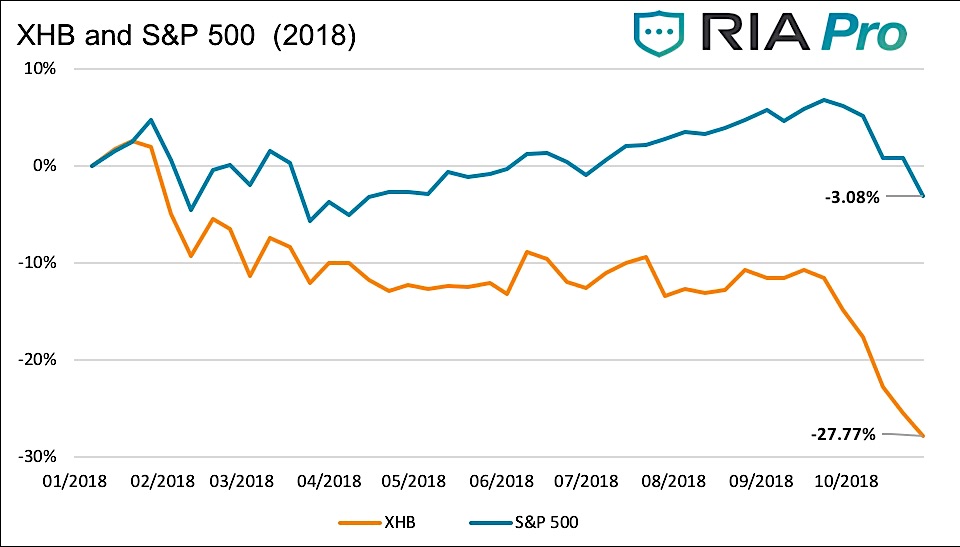
Data Courtesy Bloomberg
Note that while the Homebuilders ETF (XHB) and the S&P 500 both fell in the first quarter, the S&P regained its footing and went on to new record highs before its recent stumble. Conversely, XHB drifted slightly lower following the first quarter decline. More recently, as interest rates rose, XHB fell precipitously. As shown, XHB is underperforming the S&P 500 by almost 25% year to date.
Looking back further, we find that since the recovery from the financial crisis beginning in March of 2009, the Homebuilders ETF (XHB) greatly outperformed the S&P 500. As shown below, in January of 2018, XHB had outperformed the S&P 500 by about 200% since March of 2009. That differential has collapsed over the last few months.
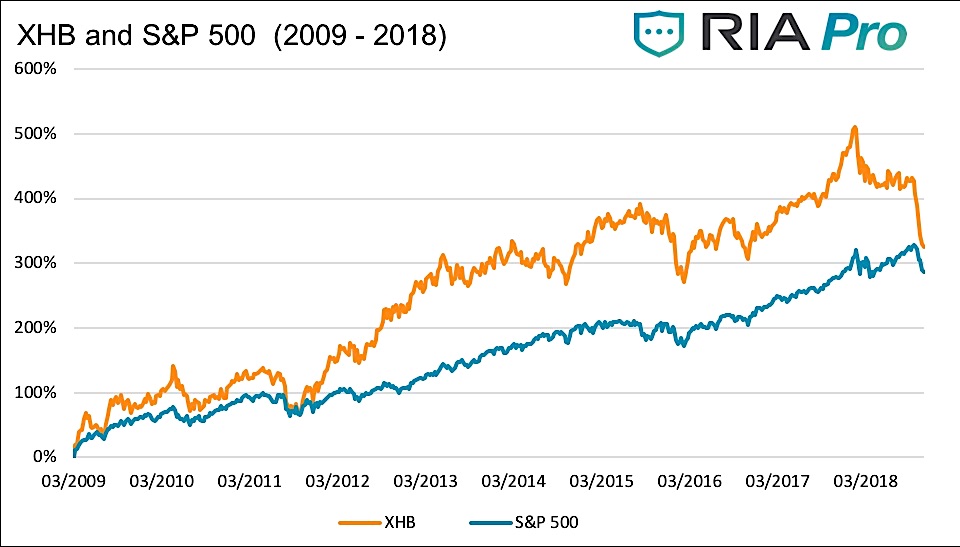
Data Courtesy Bloomberg
Statistically, XHB and the S&P have had a strong long-term correlation (2006-present) of +.71, meaning that 71% of XHB’s price can be explained by changes in the price of the S&P 500.
Interestingly, the Homebuilders ETF (XHB) has a +.21 correlation with ten-year U.S. Treasury yields over the same period. The positive relationship is not what one should expect as it implies that yields and XHB have risen and fallen together. Keep in mind, the relationship is not strong but the positive relationship is notable.
Recently, however, as bond yields broke out of ten-year ranges, reached five-year highs and brushed up against key long-term technical levels, XHB investors became concerned. Since September 2018, the correlation between XHB and ten-year Treasury yields has been -.58 and greatly reflects the lagged effects of rising interest rates on housing activity. We suspect this statistically relevant negative correlation will persist and perhaps strengthen as long as rates keep rising.
Investment Implications
The rest of this article, including our investment conclusions, is only available for subscribers of RIA Pro. To try out this new service with a 14 day free trial period. To sign up visit us at RIA Pro.
Twitter: @michaellebowitz
Any opinions expressed herein are solely those of the author, and do not in any way represent the views or opinions of any other person or entity.


