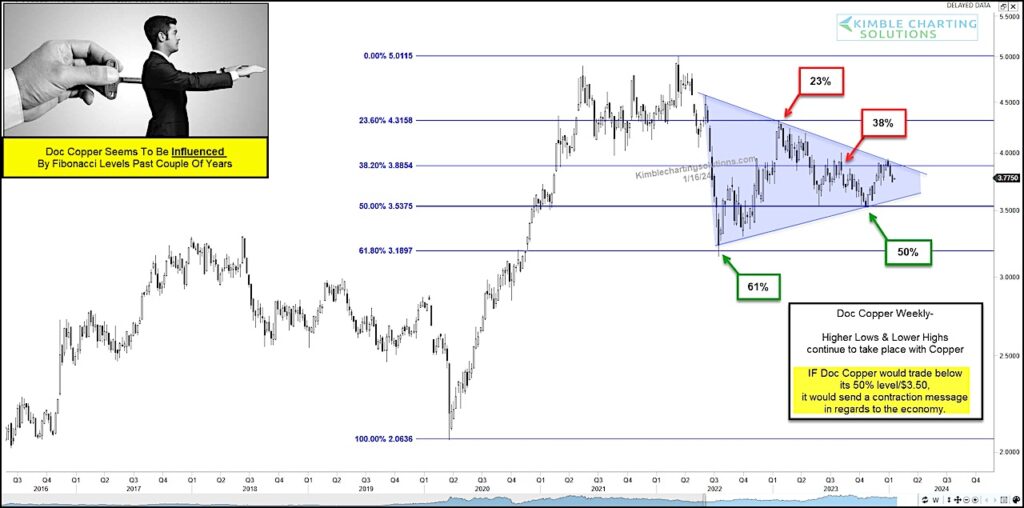
After peaking in 2021, copper prices declined sharply before bouncing around for a few years. That “bouncing” ended up following the twists and turns of Fibonacci rules.
And we can see this in today’s “weekly” chart of Copper.
Yes, Doc Copper seems to be under the influence of Fibonacci.
The initial decline hit the 61% Fib before bouncing to the 23% Fib. After a touch of the 38% Fib, Copper fell to the 50% Fib… before bouncing again.
All of this price action ended up forming a large pennant pattern. And when Copper finally breaks from this pennant pattern, it will send an important macro decision the broad market. A breakout would be bullish for the economy while a breakdown would be bearish. Stay tuned!
Copper “weekly” Chart
Note that KimbleCharting is offering a 2 week Free trial to See It Market readers. Just send me an email to services@kimblechartingsolutions.com for details to get set up.
Twitter: @KimbleCharting
The author may have a position in mentioned securities. Any opinions expressed herein are solely those of the author, and do not in any way represent the views or opinions of any other person or entity.


