China has become critical factor in the global equity markets in the 21st century.
Today we look at the etf $FXI for China’s stock market and show how U.S. investors have received several timely bullish and bearish signals over the past decade plus (when comparing FXI with the S&P 500 – $SPY).
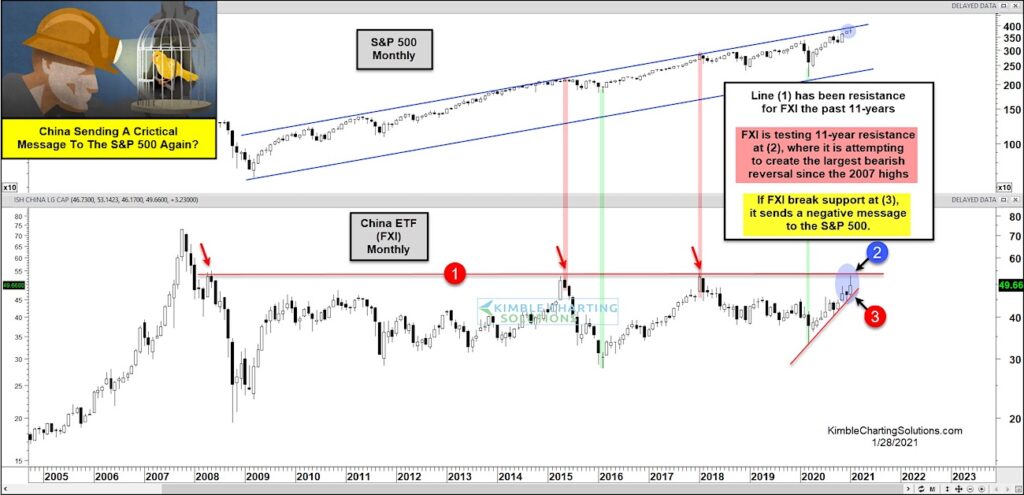
In today’s chart 2-pack, you can see how the S&P 500 has been in an uptrend since the 2009 low while the China ETF $FXI has traded sideways. Each time $FXI has bumped into resistance at line (1) it has formed a bearish reversal (marking a short-term peak).
More importantly, those reversals have been canaries in the coal mine for US investors… marking a trading top for the S&P 500 each time as well.
$FXI is currently testing 11-year resistance at (2), where it is attempting to create the largest bearish reversal since the 2007 highs. And this is occurring as the S&P 500 tests channel resistance.
If $FXI breaks down through its up-trend support line at (3), it would send a negative message to the S&P 500. Stay tuned!
S&P 500 (SPY) versus China ETF (FXI) “monthly” Chart
Note that KimbleCharting is offering a 2 week Free trial to See It Market readers. Just send me an email to services@kimblechartingsolutions.com for details to get set up.
Twitter: @KimbleCharting
Any opinions expressed herein are solely those of the author, and do not in any way represent the views or opinions of any other person or entity.


