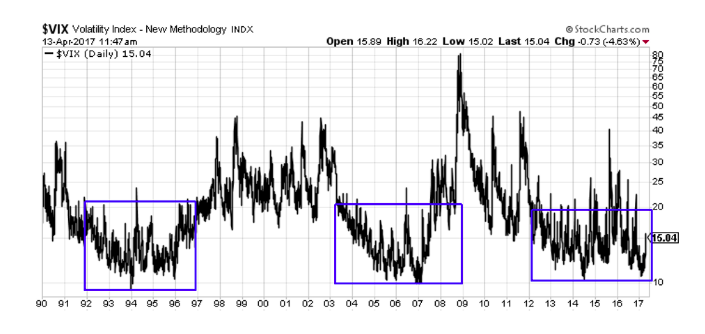
Over the weekend, I read an article arguing that we are potentially about to enter a bull market in volatility – see VIX Volatility Index chart below for reference (INDEXCBOE:VIX).
The writers argument was that we have had an extended period of low volatility since 2012, similar to what we saw in 1992-1997 and 2003-2007.
However, the third box below is flawed in my opinion because there were numerous times in the last few years that the VIX jumped above 20.
VIX Volatility Index Chart (1990-present)
In my opinion, we experienced a “stealth” bear market in 2015. While indexes didn’t hit the technical 20% correction level that defines a bear market, many individual stocks and sectors declined more than 20%. The major indexes were held up by a select number of large cap stocks.
I think this low level of volatility could persist for a while, albeit with the occasional spike. We are certainly coming into a historically weak time of year and with VIX showing a 10 handle, we can’t go much lower from here.
The low VIX represents a series amount of complacency and lack of awareness of aggressive downside moves in equities.
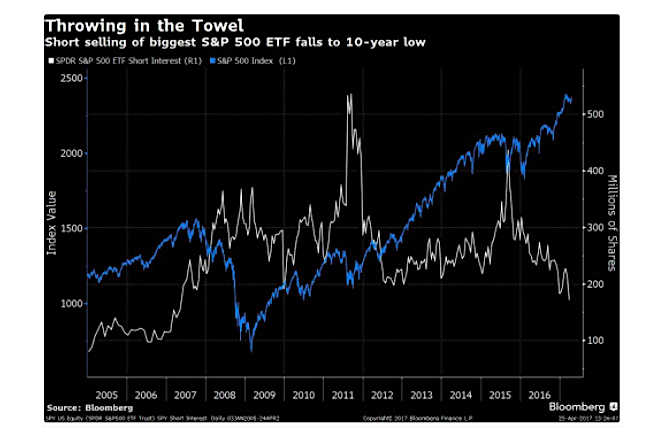
You can also see that the level of short sellers in the markets right now (i.e. S&P 500 ETF – NYSEARCA:SPY) are very low as we are at or close to all-time highs.
Personally, I don’t think going long volatility here is the right move, but I’m am certainly lightening up on short Vega trades and also using strategies like out-of-the-money put calendars which is one of my favorite hedging strategies.
Catch more of my options trading analysis over at my site Options Trading IQ. Thanks for reading.
Twitter: @OptiontradinIQ
The author does not have a position in mentioned securities at the time of publication. Any opinions expressed herein are solely those of the author, and do not in any way represent the views or opinions of any other person or entity.


: Showing Some Signs of Emerging Strength")
