
Last week gave investors another sequence of big ups and downs. This sort of price action is typical of corrections or bear markets. And it likely means that it will take some time for a durable stock market bottom to form.
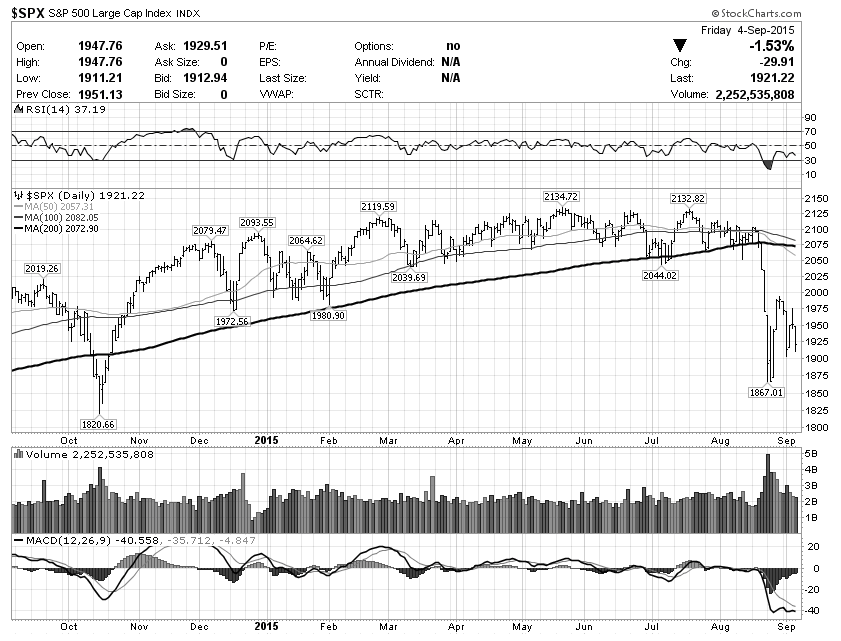
The week started off with the S&P 500 Index getting rejected off the 1990-2000 resistance area and plunging nearly 100 points by the end of the day on Tuesday. Wednesday and Thursday brought a temporary bounce back to 1970-1980, but the market ended the week with another broad sell-off.
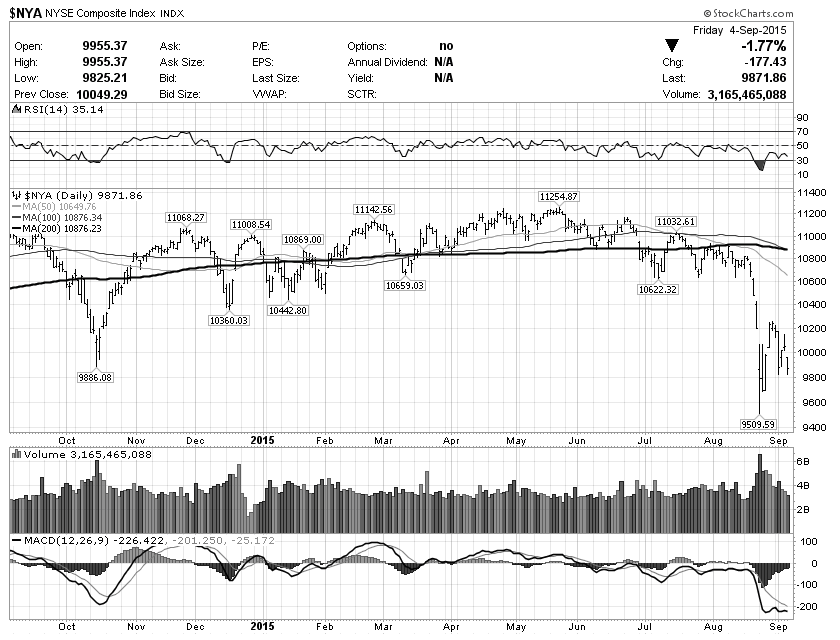
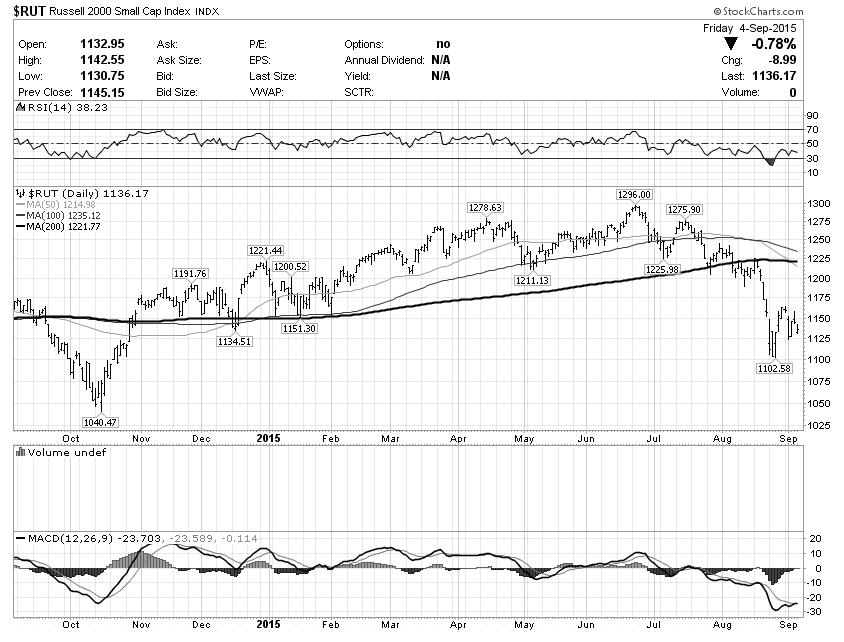
The price structure of most major indices looks almost identical:
- All are under their 200 day moving averages.
- All had oversold bounces off the “Crash Monday” lows.
- And all ran into various resistance levels and failed last week.
In short, stocks look vulnerable to another leg down in the short term. This sort of price action is normal for these market conditions as well as necessary for the market to find a more durable stock market bottom and perhaps reach the end of the correction. Remember that price discovery brings volatility and is a reflection of the emotions in the marketplace.
The following is a review of select indices and sectors:
OCTOBER LOWS COMING? – S&P 500 Large Cap Index (SPX): Weak close on Friday after two rejections at resistance indicate the path of least resistance for stocks remains DOWN. The first solid support is around the Crash Monday lows at 1865 and then the October 2014 lows around 1820.
ALMOST THE SAME – NYSE Composite Index (NYA): Basically the same price structure… oversold bounce now failing – path of least resistance is down.
COPY AND PASTE… – Russell 2000 Small Cap Index (RUT): Basically the same price structure… oversold bounce now failing – path of least resistance is down.
Continue reading for charts of Materials (XLB), McClellan Oscillator, and a big picture view of the S&P 500…