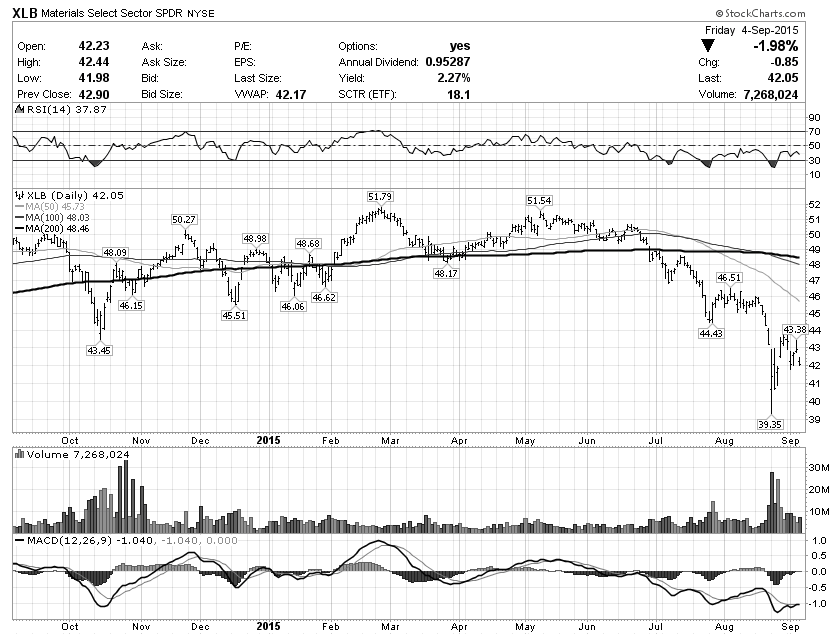
MORE OF THE SAME – Materials Sector ETF (XLB): Basically the same price structure… the oversold bounce is failing – path of least resistance is down.
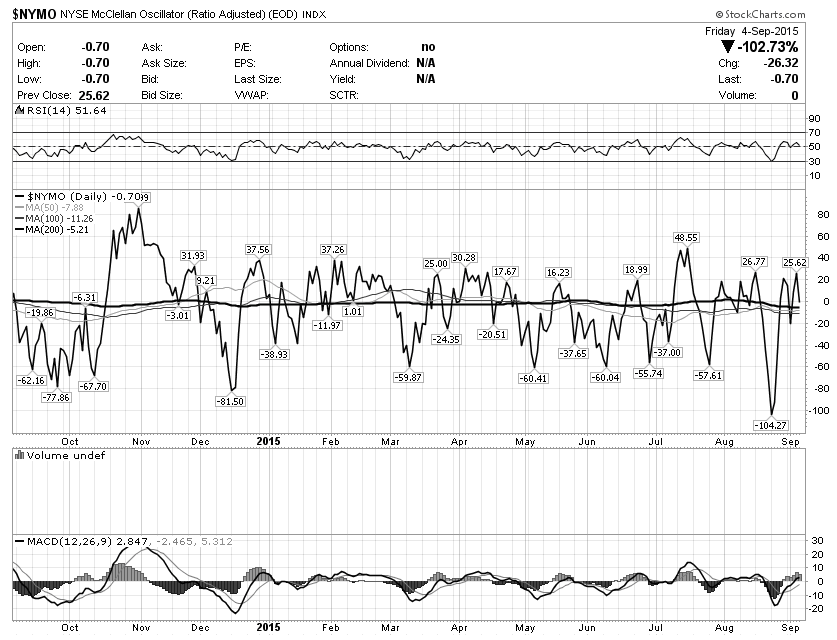
NOT OVERSOLD – NYSE McClellan Oscillator (NYMO): Despite the significant market gyrations, the McClellan Oscillator ended the week near the “zero” mark, suggesting the market has ways to go before we can consider it oversold.
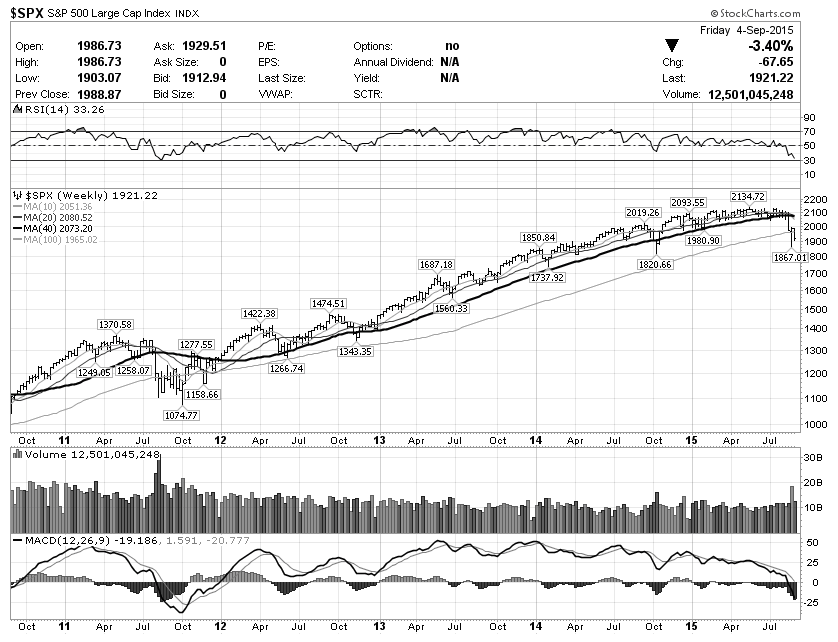
LIGHT AT THE END OF THE TUNNEL? – Weekly Chart of S&P 500 Large Cap Index (SPX): On the longer-term time frames we do have what looks like a major top. However, there are also some signs that the current correction may be getting close to some kind of a bottom. For example, the RSI indicator is reaching levels not seen in several years and last week’s volume was notably lighter. This is not to suggest that “the” bottom is imminent, but next move lower to re-test the lows may lead to a stronger and more technically significant reversal.
Thanks for reading and good luck navigating the market this week.
Twitter: @NoanetTrader
Read more from Drasko’s blog, NoanetTrader.
Any opinions expressed herein are solely those of the author, and do not in any way represent the views or opinions of any other person or entity.

 Testing Important Price Support")
: Cup (and Maybe Handle) Watch")

