Last week’s massive U.S. corn sales to China underscored by Friday’s (1/29) sale of 2.108 MMT, which was the second largest daily sale on record, have once again stoked a surge in self-avowed “$6.00 – $6.25” Corn Bulls.
That said is that now a rational upside price target for March 2021 corn futures?
Here is what we know
Last week, China was a buyer of approximately 5.85 MMT (230 million bushels) of U.S. corn. This increased crop year-to-date, 2020/21, U.S. corn sales to China to 17.7 MMT (697 million bushels). However, this would not include current U.S. corn sales to “unknown” destinations, a percentage of which could eventually prove to be additional PRC corn buys.
Meanwhile, the USDA Ag Attaché in Beijing continues to project total 2020/21 China corn imports (from all destinations; including U.S., Brazil, and Ukraine) at 22.0 MMT, which would be 4.5 MMT higher than the USDA’s forecast in its January 2021 WASDE report. Furthermore, privately there are certain analysts estimating a Chinese corn import figure as high as 25.0 MMT.
Here is what we don’t know
The market does not know if there remain any outstanding additional China – U.S. corn purchases coming in the near future. China’s corn buys have largely been unpredictable and lacking any identifiable patterns or potential price triggers. The market also doesn’t know if China will eventually look to cancel some or most of these recent purchases, once they feel more secure about the size and timing of Brazil’s safrinha corn crop, which accounts for approximately 70% of total Brazil corn production and is harvested primarily during May – July. As I have stated in prior commentaries, China’s track record on canceling its U.S. corn purchases is well-documented and far from an anomaly.
How then do corn traders position themselves in a market that has already rallied 32% from the March corn futures close of $4.20 ¾ on December 1st, 2020 up to Monday’s (2/1) new contract high of $5.55 ¾?
I’m still of the opinion that with front-month corn futures (CH21) now trading at their highest level since July 2013, being somewhat defensive, as far as rewarding the rally with sales, still merits ample consideration. My preference would be to own calls (or long call collars) against fixed sales, versus blindly wagering all, on the continuing chorus from Corn Bulls proselytizing that the path to $6.00 – $6.25 March corn futures is all but a foregone conclusion.
Keep in mind the following when assessing the rationale behind a price move to $6.00 – $6.25 in March corn futures. Corn Bulls would argue that the 2020/21 U.S. corn stocks-to-use ratio is headed below 8.5% in the February 2021 WASDE report via a 300 million bushel increase to U.S. corn exports. In this scenario, 2020/21 U.S. corn ending stocks would fall to 1.252 billion bushels. In recent history the closest analog S&D comparison would be 2012/13, which featured a final stocks-to-use ratio of 7.4% and corresponding rallies in corn futures well above $6.00 per bushel.
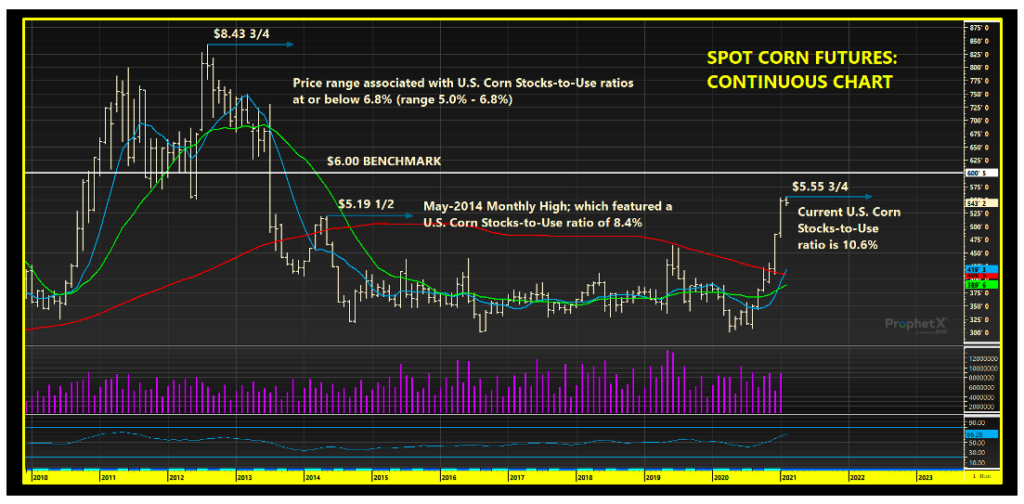
However when I examine more closely the monthly stocks-to-use ratios (as reflected in the USDA’s monthly WASDE reports) that directly led to the rallies above and beyond $6.00 it was more closely associated with stocks-to-use ratios ranging from 5.0% to 6.8%. In 2012/13 the final stocks-to-use ratio increased to 7.4% by the end of crop year due to sustained demand rationing achieved by $6.00 plus corn futures and stocks-to-use ratios that averaged 6.0% from January 2013 – May 2013. See tables below with representative crop years and the monthly average spot corn futures prices:
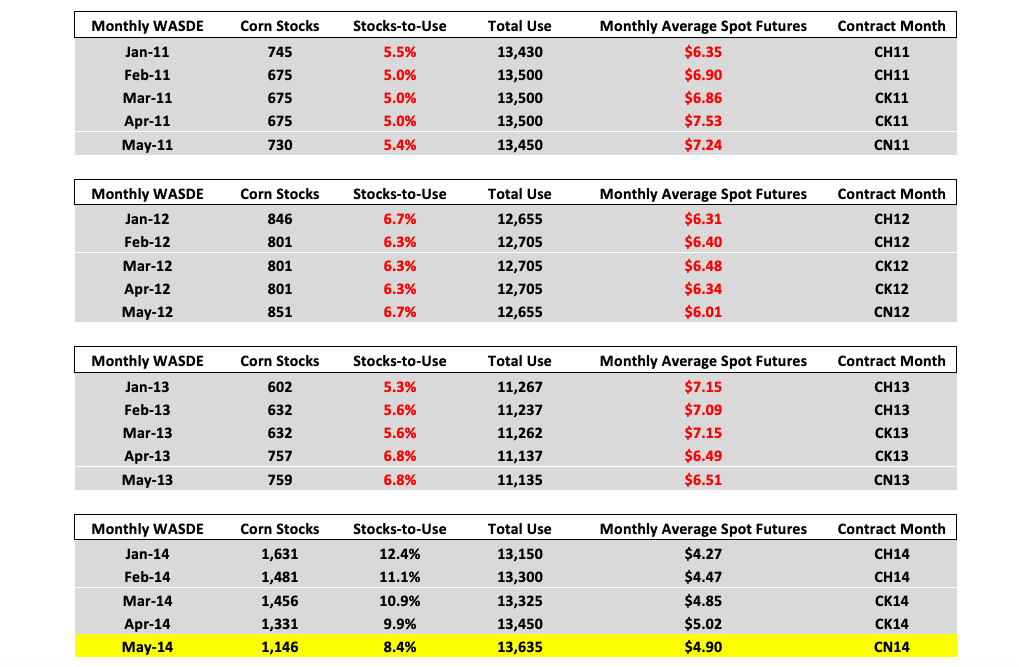
As you can see from January – May, in years 2011, 2012, and 2013, the corn market was consistently pricing in U.S. corn stocks-to-use ratios ranging from 5.0% to 6.8%. This led to spot corn futures trading sustainably over $6.00 per bushel. HOWEVER, also worthy of pointing out is that by January – May of 2014 the monthly U.S. corn stocks-to-use ratios had improved dramatically resulting in much lower spot corn futures prices. Furthermore in May 2014 spot corn futures averaged $4.90 per bushel, which at that time was reflecting a stocks-to-use ratio of 8.4%. As I said, previously if the USDA raises corn exports 300 million bushels in the February 2021 WASDE report and makes no additional changes to the balance sheet, the 2020/21 U.S. corn stocks-to-use ratio would fall to 8.4% from its current level of 10.6%.
Does this mean March 2021 corn futures can’t rally to $6.00 to $6.25 per bushel? No. This is 2021 and by virtue of what we’re seeing right now in the equity markets, anything is possible if the right people/money get behind a specific stock and/or commodity. Furthermore, Money Managers have already been designated as the primary force in rallying March 2021 corn futures to $5.50 per bushel with their net length last estimated at +364,229 contracts (exceeding the maximum length Money Managers held in 2012, which corresponded with $8.00 September corn futures). Therefore I’m far from suggesting that simply because at present the current S&D doesn’t warrant a $6.00 price response based on historical precedent, that it can’t happen. However, as a continued measure of caution…markets go up and down, and at the point the money perceives China’s corn needs have been satisfied and/or the USDA doesn’t oblige Corn Bulls with a stocks-to-use ratio under 8.5%, price momentum can shift quickly and violently.
Twitter: @MarcusLudtke
Author hedges corn futures and may have a position at the time of publication. Any opinions expressed herein are solely those of the author, and do not in any way represent the views or opinions of any other person or entity.


