The following research was contributed to by Christine Short, VP of Research at Wall Street Horizon.
Executive Summary
- Capital markets are much softer versus a year ago as the number of IPOs and SPACs is down sharply
- Investors continue to grapple with a changing macro landscape while bankers struggle with higher costs of capital
- Traders must pay close attention to share lock-up period expiration dates as this market-moving corporate event can lead to volatility spikes
The first-quarter earnings season was a mixed bag across the Financials sector. While the group reported the third-largest aggregate earnings surprise among the eleven sectors, Financials’ total earnings-per-share (EPS) growth change was –19.8%, according to FactSet. Citigroup and Goldman Sachs reported strong profits and Bank of America’s Brian Moynihan was upbeat about the state of the consumer. Jamie Dimon at JPMorgan Chase was less sanguine, citing a myriad of challenges in the global macroeconomy.
Bursting the Bubble
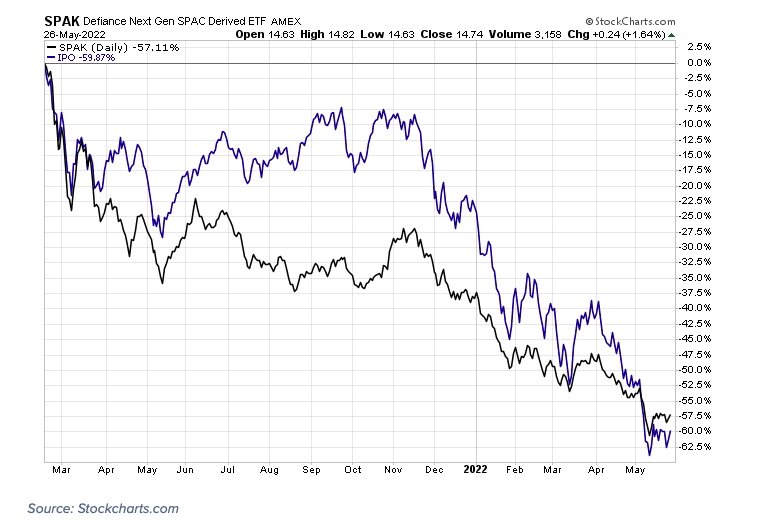
Still, there’s no doubt that the capital markets are nothing like they were in early 2021. A year ago, initial public offerings (IPOs) and special-purpose acquisition vehicles (SPACs) were all the rage. Look no further than at the performances of two once-popular ETFs tracking these spaces: The Defiance Next Gen SPAC Derived ETF (SPAK) and the Renaissance IPO ETF (IPO) have both plunged more than 50% off their February 2021 all-time highs.
SPAK and IPO ETFs Plunge Following the February 2021 Peak in Capital Market Speculation
Capital Markets: Hot to Cold
Low interest rates and a surge in the money supply helped foster a capital-raising crescendo. People had more cash on hand than they knew what to do with, so investors put it to use in promising (and many not-so-promising) ventures. It turned out to be throwing good money after bad, at least according to trends in the last 15 months. Last November as the Fed began to telegraph higher interest rates ahead, companies’ future cash flows were greatly discounted, and investors fled the IPO and SPAC spaces.
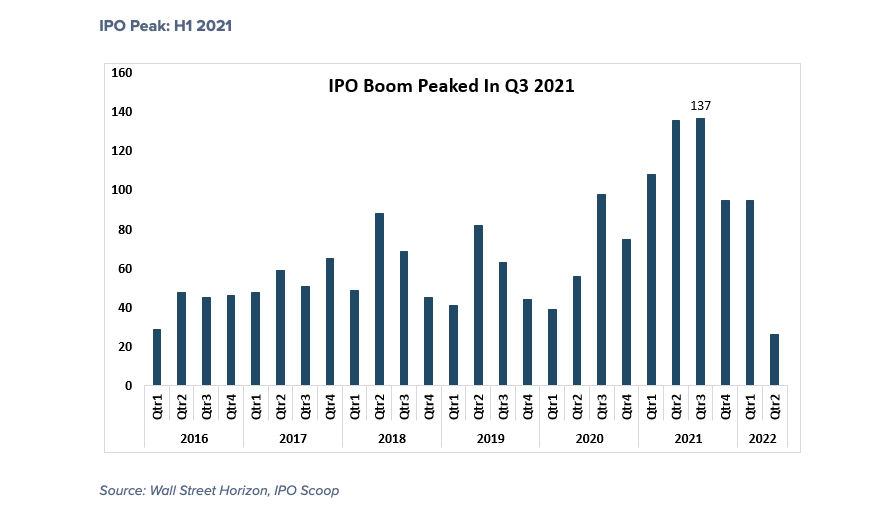
Plotting the IPO Boom
Wall Street Horizon tracks capital market data closely. It helps our customers stay on top of global market trends to manage risk. Our data underscores just how bubbly buyers were early last year. By our count, the IPO boom peaked around the end of the first half of 2021. Between Q2 and Q3 last year, there were more than 250 global IPOs. 2021’s fourth quarter and Q1 of this year featured under 200 in all. And the current quarter’s sum is paltry compared to year-ago levels thus far.
IPO Peak: H1 2021
SPAC Speculation
The number of SPACs hitting the tape is even more of a shocking trend. Coinciding with the top in ETF prices, the count of firms going public via SPAC was 251 in Q1 2021. The market cooled in the months thereafter. Even with a mini peak late last year, the current quarter tracks very lightly in terms of SPAC issuance.
SPAC Peak: Q1 2021
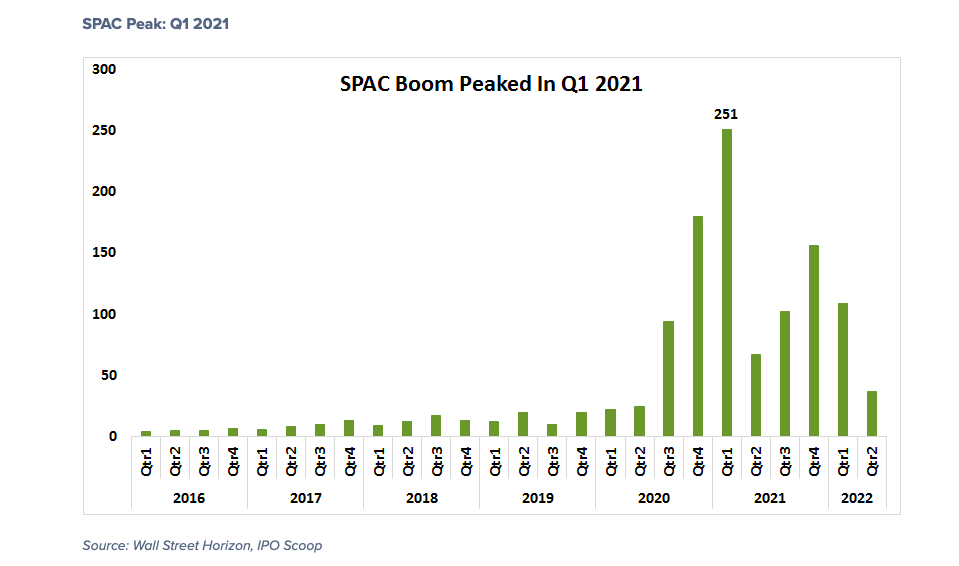
Total SPACs for Q1 were off a whopping 57% year-on-year while the IPO count dropped just 13%. Nevertheless, SPACs remain much more popular than they were pre-pandemic. Moreover, we find that there are more SPACs than traditional IPOs so far in 2022.
Lock-Up Period Risk
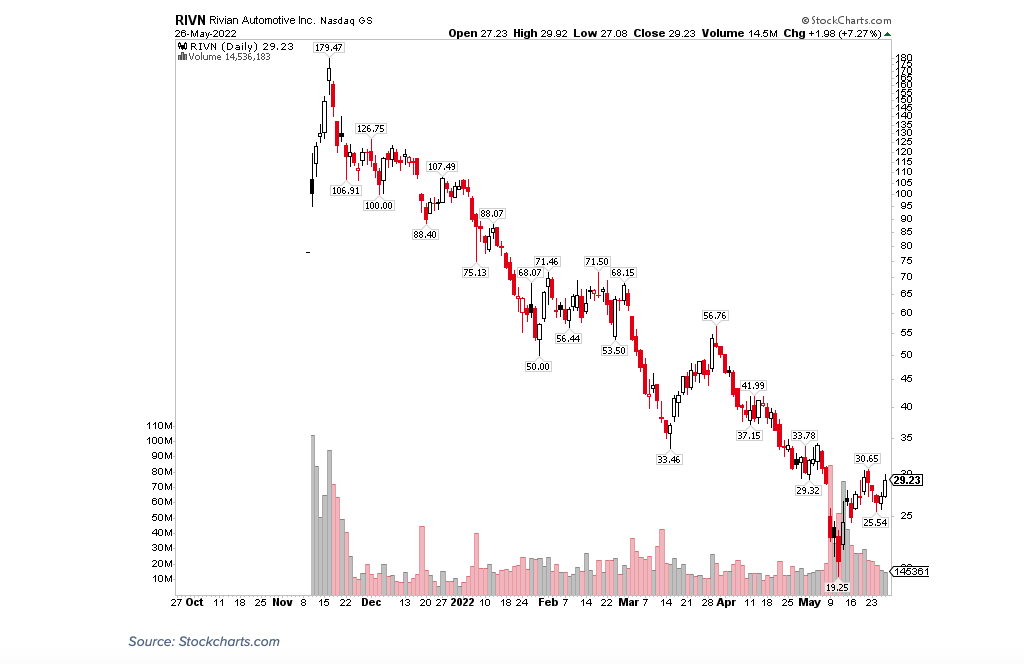
A crucial corporate event involving new companies coming to the public markets is the share lock-up period expiration date. Stock prices are undoubtedly driven by changes in supply and demand, and when a supply of shares floods the market, volatility can arise quickly. Just look at what happened to Rivian (RIVN) a month ago. Following its May 8 lock-up expiration date, the stock cratered. Shares of the EV automaker hit a low under $20 Tuesday that week. The stock then rallied after the selling pressure was alleviated. Stay tuned for Rivian’s annual shareholder meeting on Monday 6/6 at 11am PST.
Rivian Stock Tumbled Following its November 2021 IPO, Bottoming After Its Lock-Up Expiration
Conclusion
What a difference a year makes. We see it in stock and bond prices and across capital markets. Investment bank profits will likely be pressured for the balance of the year amid the sharp decline in IPO and SPAC activity. As for traders and money managers, keeping close tabs on what’s happening in the primary market and with firms going public can help gauge risk appetite. There’s no doubt that a quickly shifting macro landscape is taking its toll on global markets.
For more information on the data sourced in this report, please email: info@wallstreethorizon.com
Wall Street Horizon provides institutional traders and investors with the most accurate and comprehensive forward-looking event data. Covering 9,000 companies worldwide, we offer more than 40 corporate event types via a range of delivery options from machine-readable files to API solutions to streaming feeds. By keeping clients apprised of critical market-moving events and event revisions, our data empowers financial professionals to take advantage of or avoid the ensuing volatility.

Christine Short, VP of Research at Wall Street Horizon, is focused on publishing research on Wall Street Horizon event data covering 9,000 global equities in the marketplace. Over the past 15 years in the financial data industry, her research has been widely featured in financial news outlets including regular appearances on networks such as CNBC and Fox to talk corporate earnings and the economy.
Twitter: @ChristineLShort
The author may hold positions in mentioned securities. Any opinions expressed herein are solely those of the author, and do not in any way represent the views or opinions of any other person or entity.
: All Energy Hands on Deck!")


: All Energy Hands on Deck!")