The New York Stock Exchange Index (NYSE) is an extremely important gauge of overall market health. Why?
According to the New York Stock Exchange website (www.nyse.com):
“..The NYSE Composite Index is designed to measure the performance of all common stocks listed on the NYSE, including ADRs, REITs and tracking stocks. In January 2003 the NYSE reintroduced the NYSE Composite Index under a new methodology that is fully transparent and rule-based. Under the new methodology, all closed-end funds, ETFs, limited partnerships and derivatives are excluded from the index. As of year-end 2004, the NYSE Composite consists of over 2,000 U.S. and non-U.S. stocks. It is a measure of the changes in aggregate market value of all NYSE-listed common stocks, adjusted to eliminate the effects of capitalization changes, new listings and delistings. The index is weighted using free-float market capitalization and calculated on both price and total return basis…”
The answer is, because, it’s a BIG INDEX and it has not made a new high like the S&P 500 (SPX – Quote) or Dow Jones Industrial Average or NASDAQ Composite. This is an important divergence that must be taken seriously.
Why? Two reasons:
- Because this divergence is extremely rare and potentially the first time it’s happened.
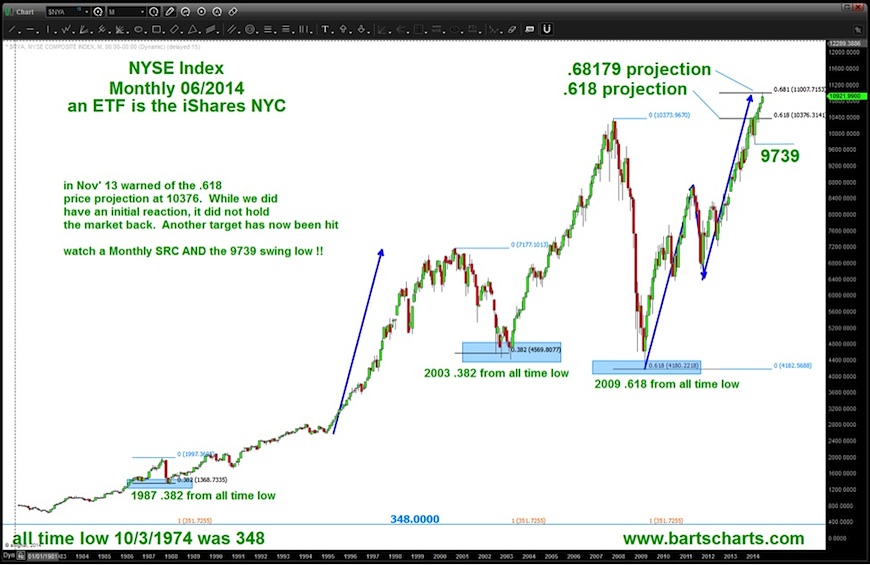
- Take a look at this chart that was posted in June 2014. As you can see, the NYSE Index has completed a sell pattern and it “hit” perfectly.
As readers of my blog and this site know, my view is that a pattern is simply a pattern. It will either work or it won’t. HOWEVER, the fact that it’s a long term pattern AND a big index should push investors to take note.
Now let’s take a look at a log scale chart of the NYSE Index.

In 2009, the NYSE bounced off the trend line created from the all time low in 1974. Note that it bounced at a “perfect” .618 retracement… and off we went. Take note of the “blue shaded rectangle” that’s the “key” trend line to this entire thing. Also, take note of the last two major tops in 2000 and 2007. If you notice we corrected and then went up for one more high …
So, while we hear about the DOW (30 stocks) making new highs and the S&P 500 making news highs, enjoy it … but also realize that a big broad index named the New York Stock Exchange (NYSE) is still struggling …
Might it make one more new high? Absolutely!
Can it scream to 12,000 or higher? Absolutely!
Could it stop in its tracks and provide a sell signal? You bet. Thanks for reading.
Follow Bart on Twitter: @BartsCharts
No position in any of the mentioned securities at the time of publication. Any opinions expressed herein are solely those of the author, and do not in any way represent the views or opinions of any other person or entity.

: Showing Some Signs of Emerging Strength")

