After falling nearly 13 percent during the September swoon, the Nasdaq Composite has rallied back to within 5 percent of its all-time highs in October.
Meanwhile, a few notorious tech stocks are not rallying with the same strength. Though there are several others (see $GOOGL), today we highlight Facebook NASDAQ: FB.
Facebook’s stock price took a hit during the COVID crash but rallied sharply as it became apparent that technologies with broad platforms for selling and advertising goods online would benefit during this transition. That rally carried FB up to $304.67 in September. Since then it corrected 20 percent and has struggled to rally with other tech names. Below we look at the chart and share some important support levels to monitor.
Note that the following MarketSmith charts are built with Investors Business Daily’s product suite.
I am an Investors Business Daily (IBD) partner and promote the use of their products. The entire platform offers a good mix of technical and fundamental data and education.
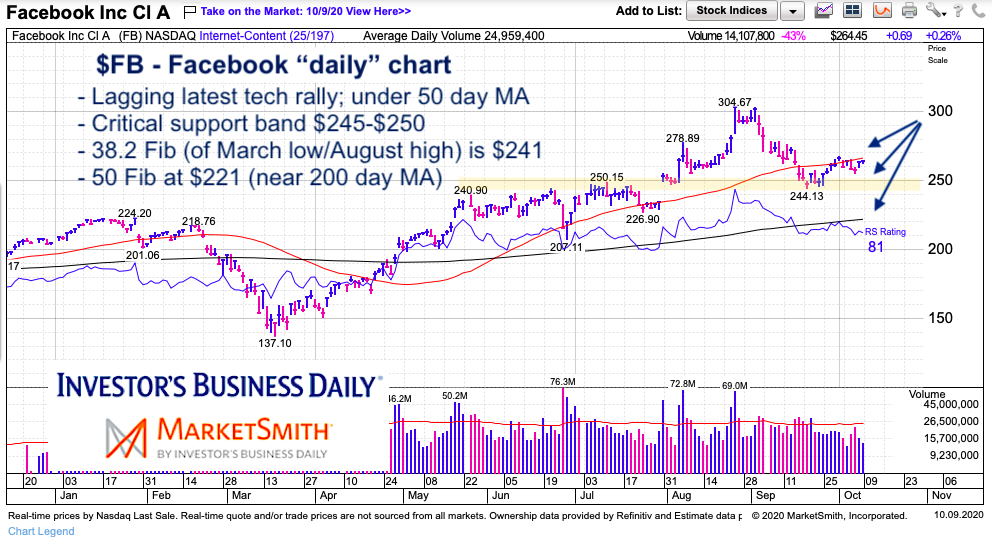
$FB Facebook “daily” Stock Chart
Facebook’s recent underperformance is pretty glaring. So there’s one of two routes to it will take here: accelerate and catch up or continue to lag and eventually catch down (to recent lows or new lows). Currently, Facebook (FB) is trading below its 50-day moving average and grinding sideways just above lateral breakout support. It has been rejected once by its short-term 38.2 Fibonacci retracement at $267. Should FB push above $267, it could target $275 (50 Fib) and $281 (61.8 Fib).
A bigger concern, however, is that the Nasdaq may need a breather after a big rally that is nearing its all-time highs. If a pullback ensues, then the laggards (like Facebook) would probably selloff.
A selloff would likely target the $240-$250 first (an area that includes breakout support, recent lows, and 38.2 Fibonacci), with further selling targeting the 200-day MA and 50 Fibonacci at $221.
Twitter: @andrewnyquist
The author may have a position in mentioned securities at the time of publication. Any opinions expressed herein are solely those of the author, and do not in any way represent the views or opinions of any other person or entity.


