S&P 500 Index INDEXSP: .INX Trading Chart
S&P 500 Trading Outlook (3-5 Days): Bullish
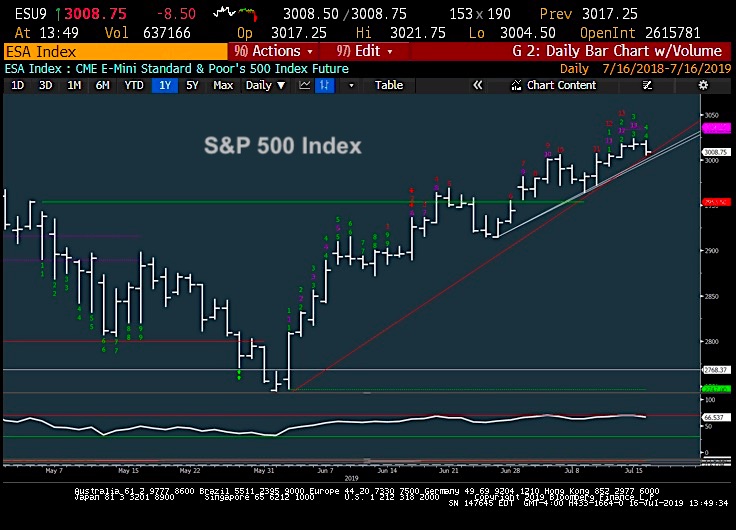
Tuesday minor selloff failed to undercut uptrends, and rallied up off its lows into end of day. Uptrend intact and should allow for 3020, 3040
SPX breached Monday’s lows, though remains above key one-month trendline support near 2992. Watch that today
One should look to buy weakness but realize that a daily close under 2992 will allow for further corrective activity.
Given the bullish nature of Tech Hardware, Hotels, and Industrials, it’s thought that selloffs still remain largely premature and 1-2 day declines really haven’t taken away from the bullish picture.
While a stallout has indeed happened, we’ll need to watch the price action for further direction.
If you have an interest in seeing timely intra-day market updates on my private twitter feed, please follow @NewtonAdvisors. Also, feel free to send me an email at info@newtonadvisor.com regarding how my Technical work can add alpha to your portfolio management process.
Twitter: @MarkNewtonCMT
Author has positions in mentioned securities at the time of publication. Any opinions expressed herein are solely those of the author, and do not in any way represent the views or opinions of any other person or entity.

: Worrisome to Broader Market?")


