We compiled a list of the 10 biggest uncertainties in the stock market right now.
In no particular order:
- China-trade wars and chip wars
- Oil and food inflation
- Strikes
- Government shutdown
- Corporate and individual bankruptcies on the rise
- Commercial real estate and banking
- Fed-rates higher for longer
- Political polarization
- Social Unrest-how far can folks be pushed economically
- Geopolitical concerns-Russia and how far will they go
What we do know is that the market is not a big fan of uncertainty.
Hence, until there is some glimmer of hope, we expect fear to prevail.
That leads us to speculate on where might hope come from?
In 2011, the government shut down. By October 2011, the market bottomed along with TLT (yields began to soften.)
Oil was at $100 a barrel and in 2012 fell to $80.
The accommodative Fed helped save the day. Plus, oil had very different fundamentals than today.
Now though, with $33 trillion in debt and rising inflation, if the Fed softens, it will help commodities prices and drive the economy towards stagflation.
We speculate that the dollar could fall as well.
In 2011 FED had wiggle room and much less of a debt issue.
Now, not so much.
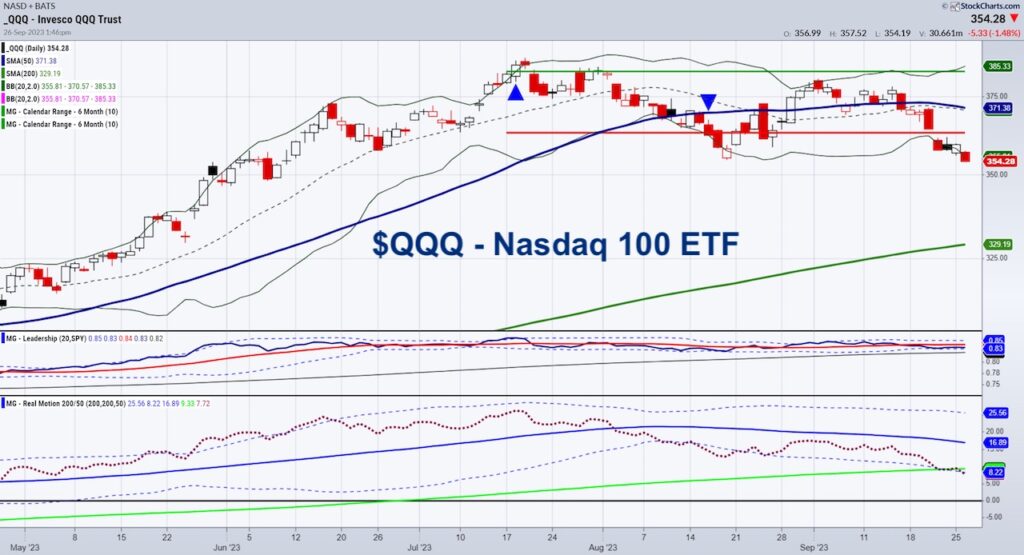
We show the NASDAQ chart as this is most likely where hope can emerge from.
Can AI and tech help efficiency while soothing the ailments of the day?
Over the weekend we looked at volatility, retail and small caps and came up with this as the Bottom line:
“A move over 18.00 or the 200-DMA in VIX, coupled with more downside pressure in IWM and XRT (watch momentum), could spell another leg lower-perhaps to 170 in IWM and 57 in XRT.
Then, we look at the monthly charts and our 80-month moving averages on both, which have held since the heart of COVID.”
Volatility cleared 18. Neither XRT nor IWM have hit the levels mentioned on the monthly chart yet.
Looking at the NASDAQ or QQQ chart, thus far it is the only index holding the August lows.
It is neck and neck in performance to SPY.
Momentum continues to have negative or bearish divergence as QQQ is now under the 200-DMA in real motion while still well above in price.
Where does hope come from?
The charts will tell us.
Should we reach a nadir of support in XRT, IWM and QQQs, buyers will come back. (market is oversold).
However, oversold can get more oversold so right now, the precipice still stares investors in the face.
Stock Market ETFs Trading Analysis & Summary:
S&P 500 (SPY) There are multiple timeframe support levels round 420-415
Russell 2000 (IWM) 170 huge
Dow (DIA) 334 support
Nasdaq (QQQ) 330 possible if cant get back above 365
Regional banks (KRE) 39.80 the July calendar range low
Semiconductors (SMH) 133 the 200 DMA with 147 pivotal resistance
Transportation (IYT) 225 next support
Biotechnology (IBB) 125 if clears impressive
Retail (XRT) 57 key support
Twitter: @marketminute
The author may have a position in mentioned securities at the time of publication. Any opinions expressed herein are solely those of the author and do not represent the views or opinions of any other person or entity.


: Important Breakout Retest")


