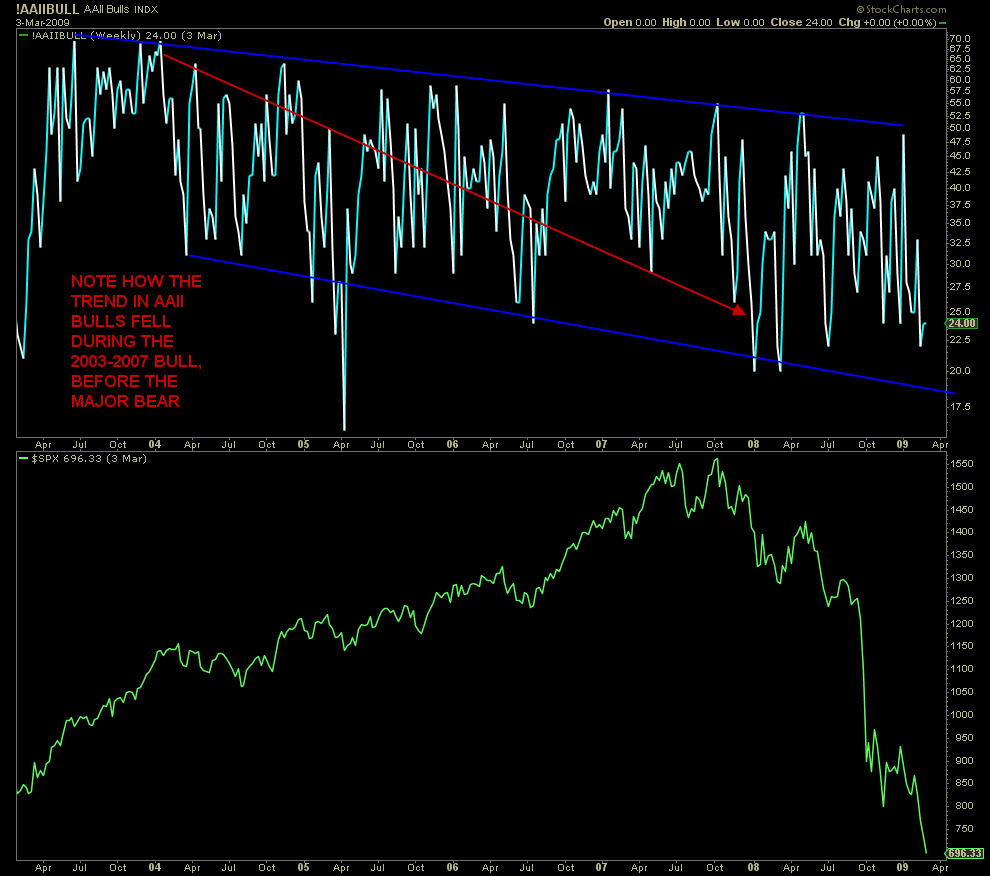
During the bull market of 2002 to 2007, I noticed something very interesting with respect to the American Association of Individual Investor’s (AAII) poll. The investor sentiment trend of this poll was getting more bearish as the S&P 500 (INDEXSP:.INX) rally and cyclical bull market aged. I said to myself, and my readers at the time, “How can this not be bullish?”
Investor Sentiment Polls Study
Individuals are the greatest contrarian indicators of all time, right up there with your Uncle Harold and the taxi driver. Generally, as stock market prices rise, investor sentiment becomes more and more bullish. Not this time. Why? Not really the technicians wheelhouse to ask why, but it could have had a lot to do with the weakening housing market as well as the smack in the face that many took during the 2000 to 2002 bear market.
So, my interpretation many years later here was that the participants in this specific investor sentiment poll were not “always” the so-called dumb money. For whatever reason, this poll, “at times” had become a smart money poll. In other words, go against what individuals are doing at your own risk.
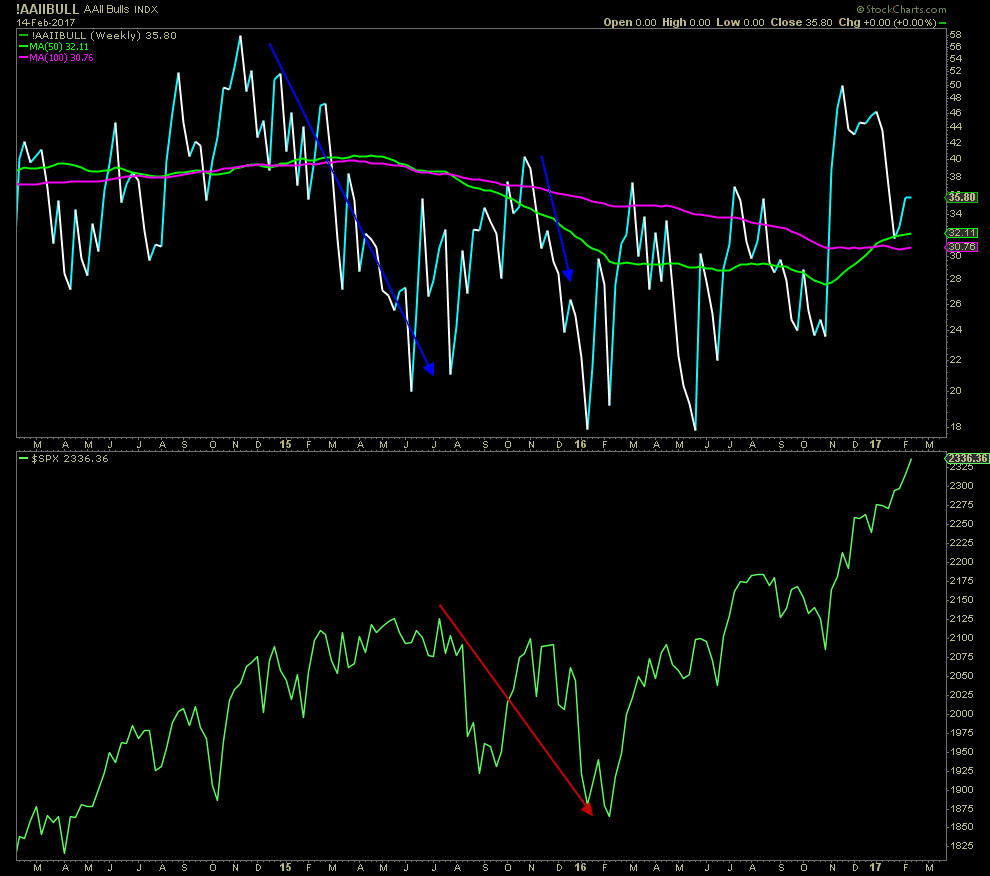
Moving forward to 2014/2016, we can see that AAII bulls peaked in November 2014 at 58%, and their numbers fell consistently all the way to a sparse 20% by June 2015. During that time, the S&P 500 moved slightly higher, so where was all this bearishness in this poll coming from? Did the individuals in this poll know something? Well they sure did as the market rolled over rather swiftly in August into a 12%+ correction.
The market as well as AAII sentiment bulls bounced into early November 2015, and then AAII bulls fell very quickly back below 25% prior to the S&P 500 Index getting pounded again. This time, from high to low, the S&P lost over 14%. Not bad for a dumb money indicator.
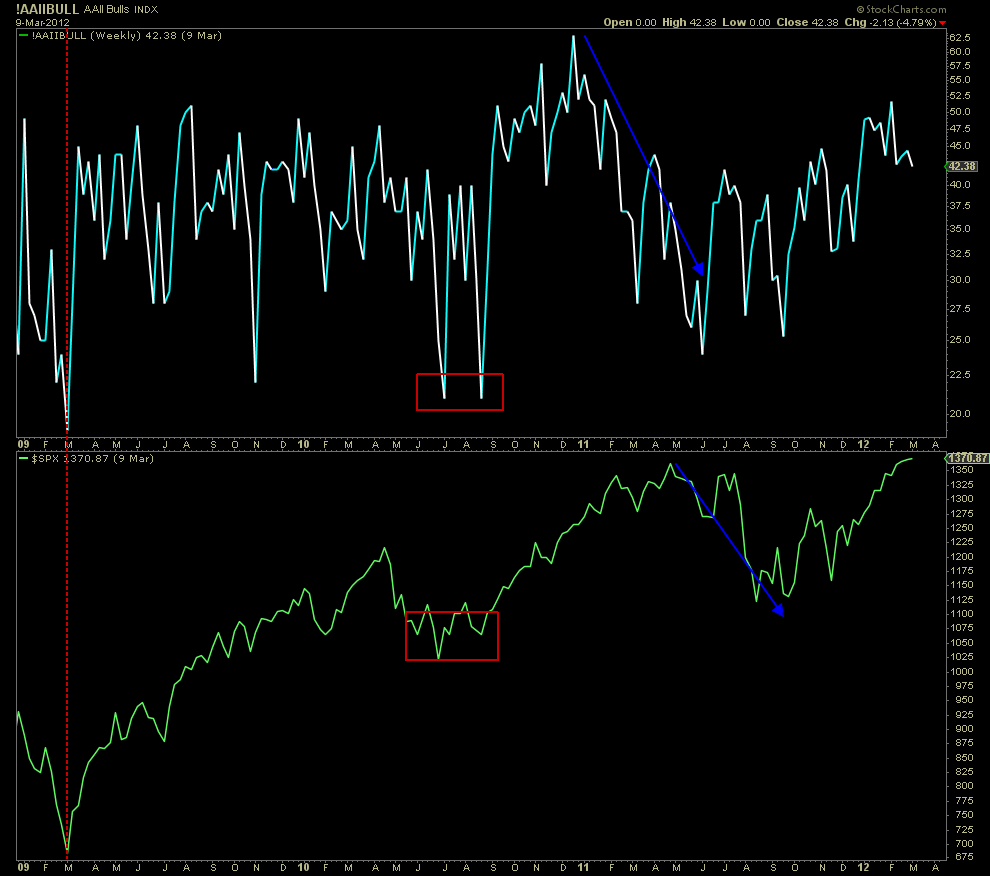
There are of course many examples when the AAII poll acted the way the majority would assume and be a great contrarian indicator. Hey, no indicator works all the time. Notice how bearish the AAII poll was at the bear market bottom in March 2009 with only 19% bulls. Also note how bearish the poll was in the summer of 2010, right at that corrective low. However, the AAII participants went back to the drawing board and after hitting 63% bulls in December 2010, starting getting more bearish during 2011. Bulls fell all the way to 24% before the wipeout in July until October of that year with the “500” declining over 21% from peak to trough.
The takeaway: Don’t assume anything in the investment world. When looking at any market indicator, get as much available data as possible. In other words, study history, not just the past year. Be open-minded.
Thanks for reading. Reach out to me at arbetermark@gmail.com for inquiries about my newsletter “On The Mark”, if interested.
Twitter: @MarkArbeter
Any opinions expressed herein are solely those of the author, and do not in any way represent the views or opinions of any other person or entity.


: Showing Some Signs of Emerging Strength")
