Key Stock Market Takeaways:
– Investor Sentiment surveys show pessimism is building, though contrarian signal has been muted of late.
– Household exposure to equities remains elevated.
– Gallup poll could have financial market (and political) implications.
October has barely begun but is living up to its reputation for Volatility INDEXCBOE: VIX. Five of the first seven trading days of the month saw an overwhelming majority (more than 5-to-1) of S&P 500 Index INDEXSP: INX stocks moving in the same direction.
September had just one such day. In addition to this volatility, there is continued evidence of weakness beneath the surface of the stock market. While the S&P 500 is just 3.5% below its 52-week high, the median stock in the index is 11% below its 52-week high and the median stock in the small-cap S&P 600 is 21% below its 52-week high.
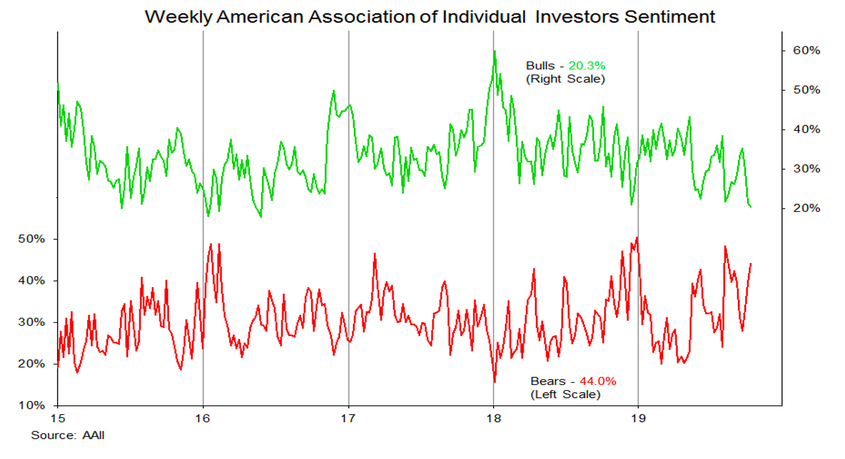
That pessimism is building is not surprising. The questions that need answering from our perspective are whether pessimism has reached an extreme that would be bullish for stocks and at time when there is so much focus on sentiment, do the indicators still provide reliable signals. This week’s AAII data shows bulls dropping to their lowest level since mid-2016.
By itself, this would suggest that optimism is pretty washed out. Bears on that survey, however, are still below the level reached in August (48%). Nonetheless, twice as many bears as bulls on the AAII survey is evidence of pessimism.
Other surveys do not reveal a similar level of pessimism. The NAAIM exposure index (which tracks sentiment among active investment managers) is at 57% – a reading similar to what was seen in June and August. While off of its highs, the survey is not showing an expansion in concern.
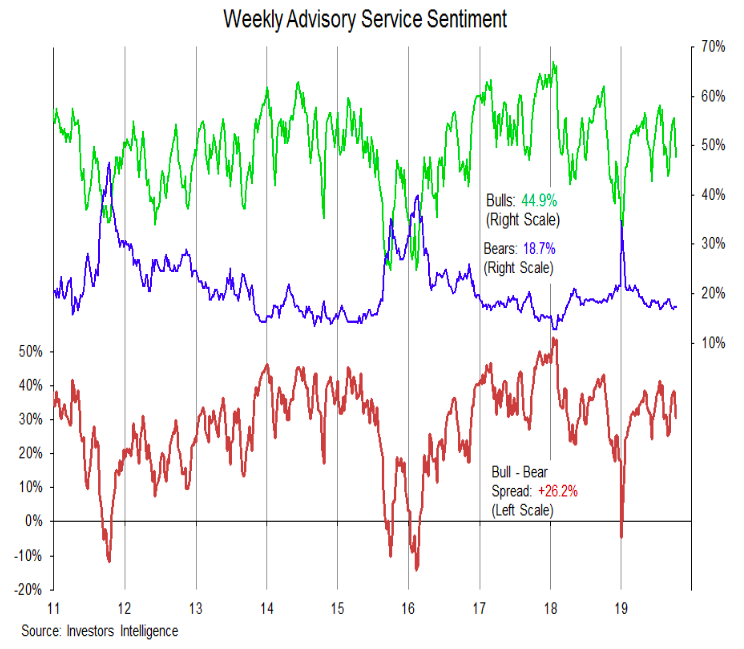
Even less concern is seen in the Investors Intelligence survey of advisory services. Bulls retreated from 55% to 48% in the latest update, but bears remain stuck near 17%. While not pointing to excessive optimism, this data is a far cry from showing the emergence of widespread pessimism. Taken together, these surveys do not point to excessive pessimism.
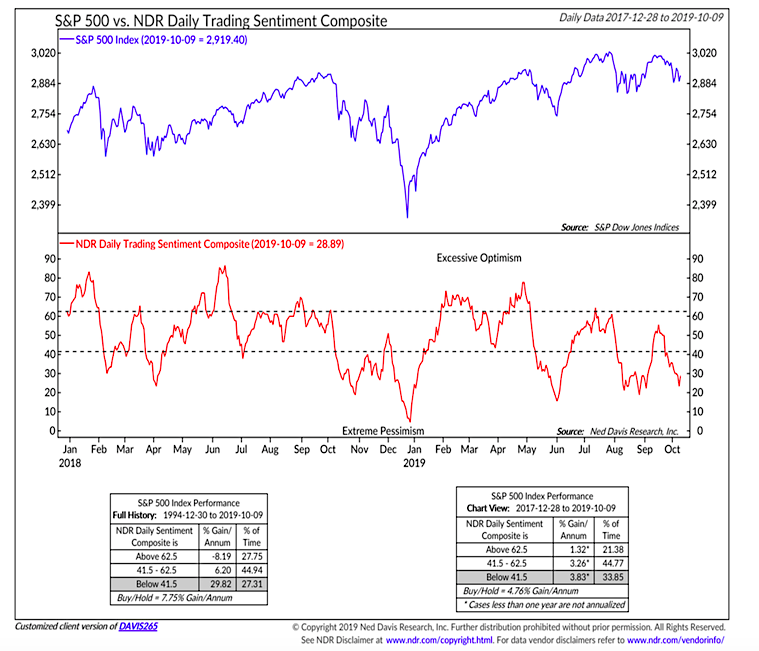
When options data (among other things) is added to the survey data, there is some evidence that pessimism has crossed into what has traditionally been considered extreme territory. So far, however, it has remained shy of the extreme readings from earlier this year (or the fourth quarter of 2018). A more important caveat, however, is that the historically favorable reward/risk tradeoff that has accompanied this level of pessimism has not been present over the past two years. Despite the volatility, the contrarian signal from sentiment has been muted of late. This may be due to the increased attention that sentiment indicators have been receiving.
An alternate explanation for the muted signal from these short-term sentiment swings may be that longer-term indicators point to still-elevated levels of investor optimism. For all the attention that weekly fund flows away from equities receive, the aggregate household exposure to equities remains at a historically elevated level. There is a strong inverse relationship between household equity exposure and forward stock market returns. In other words, despite how investors have claimed to feel on a week-to-week basis, they have largely remained fully invested in stocks.
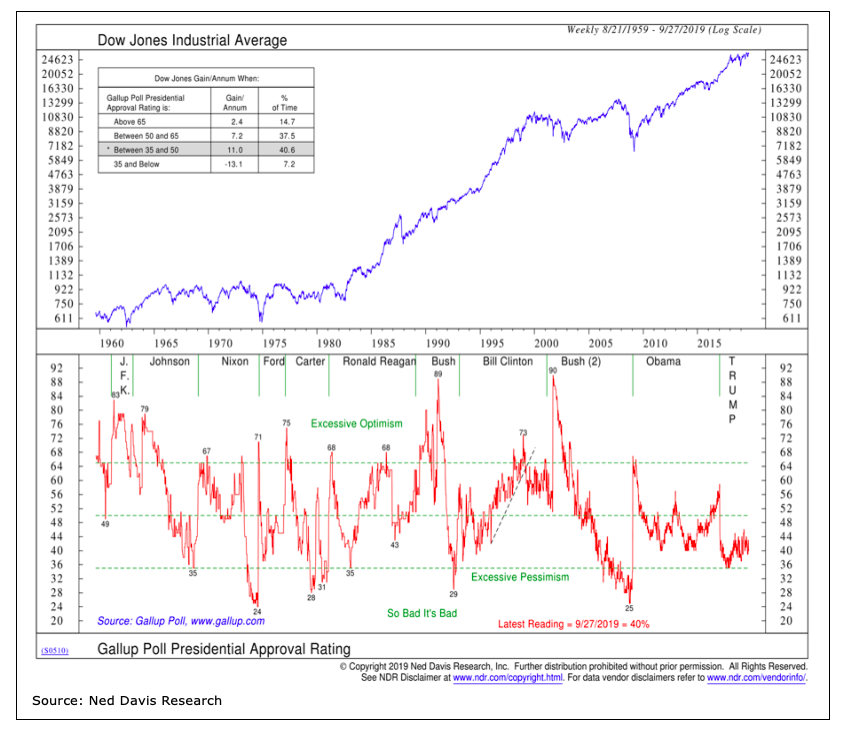
One final sentiment caveat – more pessimism is not always better for stocks, especially when it comes to political considerations. When presidential approval ratings have been low but not awful, stocks have tended to do well. When the Gallup Presidential approval rating has slipped below 35%, however, sentiment becomes so bad, it’s bad and stocks have sold off. When Bill Clinton was facing impeachment, his approval rating improved over time (and he remained in office). When Richard Nixon was facing impeachment, his approval rating declined precipitously (and he resigned before his term was over). The outcome, both politically and financially, may depend on whether the president’s approval rating turns sharply lower.
Twitter: @WillieDelwiche
Any opinions expressed herein are solely those of the author, and do not in any way represent the views or opinions of any other person or entity.

: Creating Bullish Divergence?")

: Creating Bullish Divergence?")


