The drop in stock market prices over the past couple weeks has been fast paced.
If there is anything we have learned it’s that markets do move faster in this day and age.
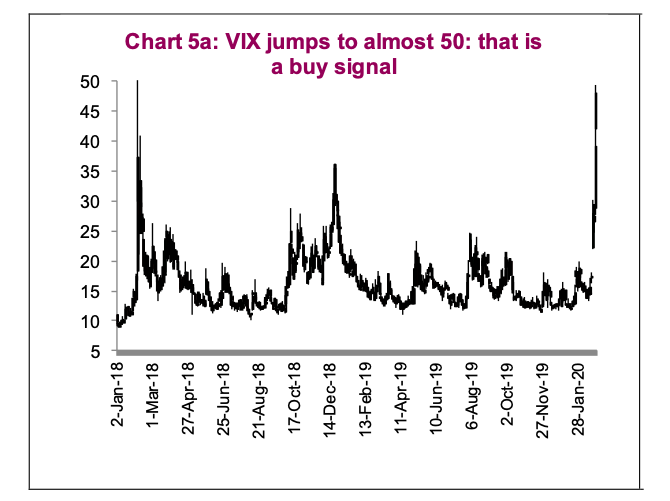
In updating our stock market correction metrics, we are now seeing many that are flashing ‘capitulation’ – historically, this has been a buying opportunity.
The VIX Volatility Index, which tracks the implied volatility of index options, is almost 50 (Chart 5a).
And perhaps the most compelling metric, the percentage of S&P 500 Index companies trading below their own 50-day moving averages is down to a mere 3%.
Chart 5c tracks stock market breadth over the past five years. (Market breadth refers to how many stocks are participating in a given move in an index or on a stock exchange.
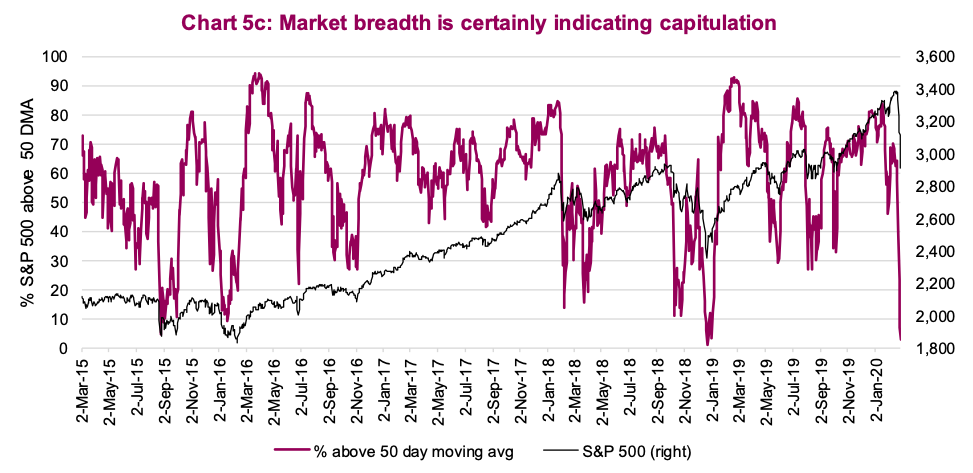
An index may be rising yet more than half the stocks in the index are falling because a small number of stocks have such large gains that they drag the whole index higher.) Typically, when this metric gets very low, markets tend to be materially higher over a few weeks or months as it often denotes capitulation. The big exception was Q4 2018, which saw markets fall, stabilize a little then fall again. It just goes to show, nothing is ever a given.
There are plenty of unknowns: How far will the coronavirus spread? To what degree will it slow the global economy and impact company earnings? Will a slowing economy tip us into a global recession? Will Sanders win the Democratic nomination?
The market is reacting and repricing itself based on numerous unknowns. At this point, we would say enough of our correction indicators are flashing ‘buy’ as an opportunistic entry point for dry powder. Oh, and if you think the risks are too great and it just doesn’t feel right, it never does during corrections. If it helps, the S&P 500 is 14% safer today than a week ago and the TSX is 10% safer (those are the amounts these benchmarks have fallen).
Source: All charts are sourced to Bloomberg L.P. and Richardson GMP unless otherwise stated.
Twitter: @ConnectedWealth
Any opinions expressed herein are solely those of the authors, and do not in any way represent the views or opinions of any other person or entity.


