For the month of July, I focus on the Investment Corporate Bond ETF (NYSEARCA: LQD).
I provide an in-depth monthly time-period technical analysis of LQD.
The same analysis can be completed for any time-period or in aggregate on investment grade corporate bonds.
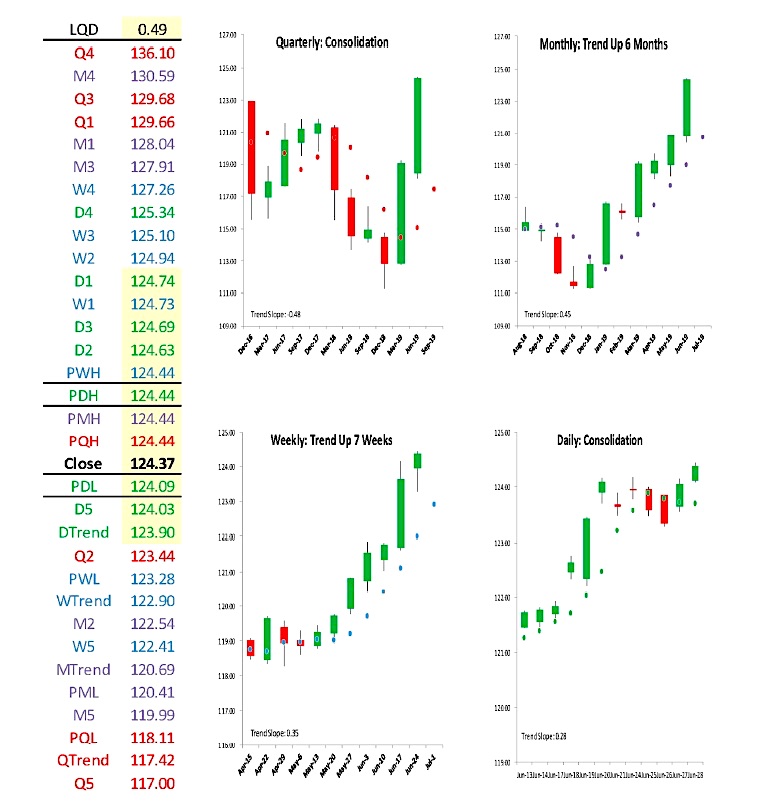
Here’s a summary of LQD market trend price data by timeframe:
– Current Settle 124.37
– Daily Trend 123.90
– Weekly Trend 122.90
– Monthly Trend 120.69
– Quarterly Trend 117.42
As can be seen in the quarterly chart below, LQD is in “Consolidation”.
Stepping down one time period, the monthly chart shows that LQD has been “Trend Up” for six months. Stepping down to the weekly time-period, the chart shows that LQD has been “Trend Up” for seven weeks.
LQD Support/Resistance:
In isolation, monthly support and resistance levels for July are:
– M4 130.59
– M1 128.04
– M3 127.91
– PMH 124.44
– Close 124.37
– M2 122.54
– MTrend 120.69
– PML 120.41
– M5 119.99
Active traders can use 124.44 as the upside pivot, whereby they maintain a long position above that level.
Active traders can use 122.54 as the downside pivot, whereby they maintain a flat or short position below it.
Technical analysis of LQD is bullish. Having said that, there are bearish technical factors to be cognizant of.
The condition was met on a quarterly basis in 1Q2019 that makes us anticipate a two-quarter low within the next three to five quarters. That can be achieved this quarter with a trade below 112.78. The condition was also met on a monthly basis in January 2019 that makes us anticipate a two-month low in July. That can be achieved this month with a trade below 118.29.
Lastly, the condition was met on a weekly basis, the week of May 27th that makes us anticipate a two-week low within the next two weeks. That can be achieved this week with a trade below 121.62.
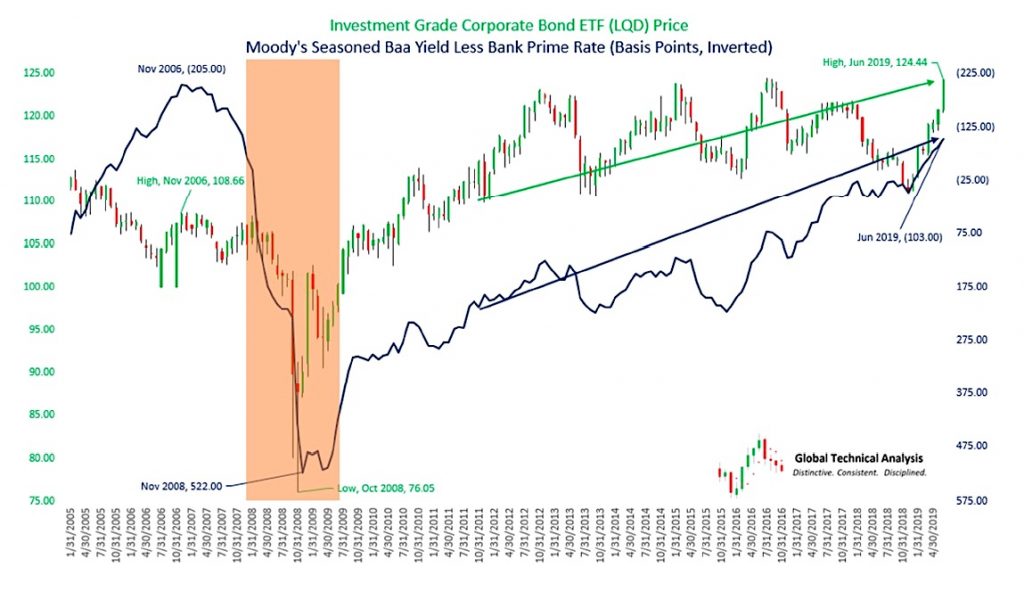
The chart above displays a monthly candlestick chart of the Investment Grade Corporate Bonds ETF (LQD) for the period of January 2005 through June 2019.
Inversely overlaid is the spread between Moody’s Seasoned Baa Corporate Bond Yields and the Bank Prime Rate, measured in basis points. As Charles Gave explains:
“Artificially depressed prime rates below the natural rate of corporate credit have allowed banks to generate ‘artificial’ money, kept zombie companies alive, but most of all permitted most viable corporations to engage in ‘financial engineering’ such as issuing debt to repurchase stocks, all of which are predicated on cheap borrowing costs continuing indefinitely, the risk, of course, is that the credit-funded party ends once the curve inverts… When the private sector curve inverts, the zombie companies will fail, capital spending will be cut, workers will be laid off, and the economy will move into recession.”
In 2006, the spread reached a trough of -205 basis points. I believe that the spread today, currently at -103 basis points will not be able to reach the 2006 level.
I also believe the pending market repricing in LQD could be much more exaggerated than the thirty-three-point decline experienced during the Great Financial Crisis. I ask that you reflect upon the following:
• In 2006, the Bank Prime Rate equaled 8.25% and Moody’s Seasoned Baa Corporate Bonds yielded 6.20%. Today those levels are 5.50% and 4.47%, respectively. (The next step is to normalize the spread relative to rate levels.)
• The size of the corporate bond market in 2006 totaled $4.9 trillion. As of the end of 2018, it totaled $9.2 trillion.
• As detailed by Michael Lebowitz in The Corporate Maginot Line, “50% of BBB companies, based solely on leverage, are at levels typically associated with lower rated companies. If 50% of BBB-rated bonds were to get downgraded, it would entail a shift of $1.30 trillion bonds to junk status. To put that into perspective, the entire junk market today is less than $1.25 trillion, and the subprime mortgage market that caused so many problems in 2008 peaked at $1.30 trillion.”
Summary
The power of technical analysis is in its ability to reduce multi-dimensional markets into a filtered two-dimensional space of price and time.
My methodology applies a consistent framework that identifies key measures of trend, distinct levels of support and resistance, and identification of potential trading ranges. My methodology can be applied to any security or index, across markets, for which we can attain a reliable price history. I look forward to bringing you our unique brand of technical analysis and insight into many different markets. If you are a professional market participant and are open to discovering more, please connect with me.
We are not asking for a subscription, we are asking you to listen. https://www.globaltechnicalanalysis.com/contact.html
Twitter: @Techs_Global
The author may have a position in the mentioned securities at the time of publication. Any opinions expressed herein are solely those of the author, and do not in any way represent the views or opinions of any other person or entity.


